See how Joshua and Sean sort garbage at the school and how you can use Venn Diagrams to sort things into sets.
- Subject:
- Mathematics
- Measurement and Data
- Material Type:
- Activity/Lab
- Game
- Interactive
- Date Added:
- 08/04/2020

See how Joshua and Sean sort garbage at the school and how you can use Venn Diagrams to sort things into sets.
This lesson unit is intended to help teachers assess how well students are able to identify linear and quadratic relationships in a realistic context: the number of tiles of different types that are needed for a range of square tabletops. In particular, this unit aims to identify and help students who have difficulties with: choosing an appropriate, systematic way to collect and organize data; examining the data and looking for patterns; finding invariance and covariance in the numbers of different types of tile; generalizing using numerical, geometrical or algebraic structure; and describing and explaining findings clearly and effectively.
This lesson unit is intended to help you assess how well students working with square numbers are able to: choose an appropriate, systematic way to collect and organize data, examining the data for patterns; describe and explain findings clearly and effectively; generalize using numerical, geometrical, graphical and/or algebraic structure; and explain why certain results are possible/impossible, moving towards a proof.
Unit 8: Data Sets and Distribution
Lesson 1: Got Data?
Students begin the unit by interacting closely with data. They collect data about themselves by measuring and answering survey questions, studying the different types of responses collected, and identifying the appropriate variables and units being measured.
Students learn about categorical and numerical data. They determine whether a particular survey question will produce one type of data or the other. They also get reacquainted with dot plots (often called line plots in earlier grades) as a way to represent data and make sense of what the data points mean in context (MP2).

Module 3 begins by extending students kindergarten experiences with direct length comparison to indirect comparison whereby the length of one object is used to compare the lengths of two other objects. Longer than and shorter than are taken to a new level of precision by introducing the idea of a length unit. Students then explore the usefulness of measuring with similar units. The module closes with students representing and interpreting data.
Find the rest of the EngageNY Mathematics resources at https://archive.org/details/engageny-mathematics.

In this 12-day Grade 2 module, students engage in activities designed to deepen their conceptual understanding of measurement and to relate addition and subtraction to length. Their work in Module 2 is exclusively with metric units in order to support place value concepts. Customary units will be introduced in Module 7.
Find the rest of the EngageNY Mathematics resources at https://archive.org/details/engageny-mathematics.
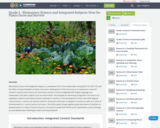
Elementary Science and Integrated Subjects is a statewide Clime Time collaboration among ESD 123, ESD 105, and the Office of Superintendent of Public Instruction. Development of the resources is in response to a need for research- based science lessons for elementary teachers that are integrated with English language arts, mathematics and other subjects such as social studies. The template for Elementary integration can serve as an organized, coherent and research-based roadmap for teachers in the development of their own NGSS aligned science lessons. Lessons can also be useful for classrooms that have no adopted curriculum as well as to serve as enhancements for current science curriculum. The EFSIS project brings together grade level teams of teachers to develop lessons or suites of lessons

Module 2 uses place value to unify measurement, rounding skills, and the standard algorithms for addition and subtraction. The module begins with plenty of hands-on experience using a variety of tools to build practical measurement skills and conceptual understanding of metric and time units. Estimation naturally surfaces through application; this transitions students into rounding. In the modules final topics students round to assess whether or not their solutions to problems solved using the standard algorithms are reasonable.

Module 2 uses place value to unify measurement, rounding skills, and the standard algorithms for addition and subtraction. The module begins with plenty of hands-on experience using a variety of tools to build practical measurement skills and conceptual understanding of metric and time units. Estimation naturally surfaces through application; this transitions students into rounding. In the modules final topics students round to assess whether or not their solutions to problems solved using the standard algorithms are reasonable.
Find the rest of the EngageNY Mathematics resources at https://archive.org/details/engageny-mathematics.

In this 20-day module students explore area as an attribute of two-dimensional figures and relate it to their prior understandings of multiplication. Students conceptualize area as the amount of two-dimensional surface that is contained within a plane figure. They come to understand that the space can be tiled with unit squares without gaps or overlaps. They make predictions and explore which rectangles cover the most area when the side lengths differ. Students progress from using square tile manipulatives to drawing their own area models and manipulate rectangular arrays to concretely demonstrate the arithmetic properties. The module culminates with students designing a simple floor plan that conforms to given area specifications.
Find the rest of the EngageNY Mathematics resources at https://archive.org/details/engageny-mathematics.

This 10-day module builds on Grade 2 concepts about data, graphing, and line plots. The two topics in this module focus on generating and analyzing categorical and measurement data. By the end of the module, students are working with a mixture of scaled picture graphs, bar graphs, and line plots to problem solve using both categorical and measurement data.
Find the rest of the EngageNY Mathematics resources at https://archive.org/details/engageny-mathematics.

Module 2 uses length, mass and capacity in the metric system to convert between units using place value knowledge. Students recognize patterns of converting units on the place value chart, just as 1000 grams is equal 1 kilogram, 1000 ones is equal to 1 thousand. Conversions are recorded in two-column tables and number lines, and are applied in single- and multi-step word problems solved by the addition and subtraction algorithm or a special strategy. Mixed unit practice prepares students for multi-digit operations and manipulating fractional units in future modules.
Find the rest of the EngageNY Mathematics resources at https://archive.org/details/engageny-mathematics.

In this 20-day module, students build their competencies in measurement as they relate multiplication to the conversion of measurement units. Throughout the module, students will explore multiple strategies for solving measurement problems involving unit conversion.
Find the rest of the EngageNY Mathematics resources at https://archive.org/details/engageny-mathematics.

In Module 1, students’ understanding of the patterns in the base ten system are extended from Grade 4’s work with place value of multi-digit whole numbers and decimals to hundredths to the thousandths place. In Grade 5, students deepen their knowledge through a more generalized understanding of the relationships between and among adjacent places on the place value chart, e.g., 1 tenth times any digit on the place value chart moves it one place value to the right. Toward the module’s end students apply these new understandings as they reason about and perform decimal operations through the hundredths place.
Find the rest of the EngageNY Mathematics resources at https://archive.org/details/engageny-mathematics.

After students observed, analyzed, and classified objects by shape into pre-determined categories in Module 2, they now compare and analyze length, weight, volume, and, finally, number in Module 3. The module supports students understanding of amounts and their developing number sense. The module culminates in a three-day exploration, one day devoted to each attribute: length, weight, and volume.
Find the rest of the EngageNY Mathematics resources at https://archive.org/details/engageny-mathematics.
This task adds some rigor to the activity of growing bean plants. By collecting growth data, students practice measuring and recording length measurements.
In this activity students measure their hand span. A line graph is used to record the data from the glass.
Unit 8: Data Sets and Distributions
Lesson 6: Histograms
In this lesson students are introduced to histograms. They learn that, like a dot plot, a histogram can be used to show the distribution of a numerical data set, but unlike a dot plot, a histogram shows the frequencies of groups of values, rather than individual values. Students analyze the structures of dot plots and histograms displaying the same data sets and determine what information is easier to to understand from each type of display (MP7). Students read and interpret histograms in context (MP2) to prepare them to create a histogram.
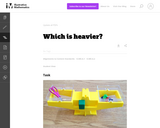
In this activity using a balance scale students practice weighing items to see how heavy they are. Cubes are used in the balance as units of measure so students may easily count them.
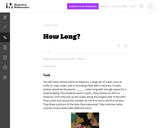
Students work in pairs to measure length by lining up cubes along the longest side of an item. They count and record length by counting the number of cubes.