The Art of the Probable" addresses the history of scientific ideas, in …
The Art of the Probable" addresses the history of scientific ideas, in particular the emergence and development of mathematical probability. But it is neither meant to be a history of the exact sciences per se nor an annex to, say, the Course 6 curriculum in probability and statistics. Rather, our objective is to focus on the formal, thematic, and rhetorical features that imaginative literature shares with texts in the history of probability. These shared issues include (but are not limited to): the attempt to quantify or otherwise explain the presence of chance, risk, and contingency in everyday life; the deduction of causes for phenomena that are knowable only in their effects; and, above all, the question of what it means to think and act rationally in an uncertain world. Our course therefore aims to broaden students’ appreciation for and understanding of how literature interacts with--both reflecting upon and contributing to--the scientific understanding of the world. We are just as centrally committed to encouraging students to regard imaginative literature as a unique contribution to knowledge in its own right, and to see literary works of art as objects that demand and richly repay close critical analysis. It is our hope that the course will serve students well if they elect to pursue further work in Literature or other discipline in SHASS, and also enrich or complement their understanding of probability and statistics in other scientific and engineering subjects they elect to take.
Apply the sampling distribution of the sample mean as summarized by the …
Apply the sampling distribution of the sample mean as summarized by the Central Limit Theorem (when appropriate). In particular, be able to identify unusual samples from a given population.
Students will use images, U.S. Census Bureau data, and interactive maps to …
Students will use images, U.S. Census Bureau data, and interactive maps to visualize and calculate arithmetic (population), agricultural, and physiological densities at local, regional, and national scales. They will also transfer their calculations to bar graphs.
This course covers sensing and measurement for quantitative molecular/cell/tissue analysis, in terms …
This course covers sensing and measurement for quantitative molecular/cell/tissue analysis, in terms of genetic, biochemical, and biophysical properties. Methods include light and fluorescence microscopies; electro-mechanical probes such as atomic force microscopy, laser and magnetic traps, and MEMS devices; and the application of statistics, probability and noise analysis to experimental data.
This task asks students to glean contextual information about bird eggs from …
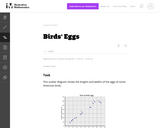
This task asks students to glean contextual information about bird eggs from a collection of measurements of said eggs organized in a scatter plot. In particular, students are asked to identify a correlation and use it to make interpolative predictions, and reason about the properties of specific eggs via the graphical presentation of the data.
Statistics is the study of variability. Students who understand statistics need to …
Statistics is the study of variability. Students who understand statistics need to be able to identify and pose questions that can be answered by data that vary. The purpose of this task is to provide questions related to a particular context (a jar of buttons) so that students can identify which are statistical questions. The task also provides students with an opportunity to write a statistical question that pertains to the context.
Submitted as part of the California Learning Resource Network (CLRN) Phase 3 …
Submitted as part of the California Learning Resource Network (CLRN) Phase 3 Digital Textbook Initiative (CA DTI3), CK-12 Advanced Probability and Statistics introduces students to basic topics in statistics and probability but finishes with the rigorous topics an advanced placement course requires. Includes visualizations of data, introduction to probability, discrete probability distribution, normal distribution, planning and conducting a study, sampling distributions, hypothesis testing, regression and correlation, Chi-Square, analysis of variance, and non-parametric statistics.
This task was developed by high school and postsecondary mathematics and design/pre-construction …
This task was developed by high school and postsecondary mathematics and design/pre-construction educators, and validated by content experts in the Common Core State Standards in mathematics and the National Career Clusters Knowledge & Skills Statements. It was developed with the purpose of demonstrating how the Common Core and CTE Knowledge & Skills Statements can be integrated into classroom learning - and to provide classroom teachers with a truly authentic task for either mathematics or CTE courses.
This task was developed by high school and postsecondary mathematics and health …
This task was developed by high school and postsecondary mathematics and health sciences educators, and validated by content experts in the Common Core State Standards in mathematics and the National Career Clusters Knowledge & Skills Statements. It was developed with the purpose of demonstrating how the Common Core and CTE Knowledge & Skills Statements can be integrated into classroom learning - and to provide classroom teachers with a truly authentic task for either mathematics or CTE courses.
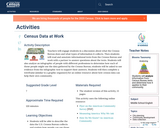
Teachers will engage students in a discussion about what the Census Bureau …
Teachers will engage students in a discussion about what the Census Bureau does and what types of information it collects. Then students will read and annotate informational texts from the Census Bureau and work with a partner to answer questions about the texts. Students will also analyze an infographic of people with different professions to determine how each of those people might use the data gathered by the Census Bureau; students will be asked to use evidence from the infographic text to support their answers. Students will then complete a wireframe (similar to a graphic organizer) for an online resource about how census data can help their own community.
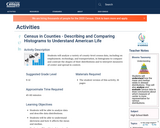
Students will analyze a variety of county-level census data, including on employment, …
Students will analyze a variety of county-level census data, including on employment, technology, and transportation, in histograms to compare and contrast the shapes of their distributions and to interpret measures of center and spread in context.
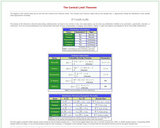
The applets in this section of Statistical Java allow you to see …
The applets in this section of Statistical Java allow you to see how the Central Limit Theorem works. The main page gives the characteristics of five non-normal distributions (Bernoulli, Poisson, Exponential, U-shaped, and Uniform).
Students will learn about their state as they collect and organize business …
Students will learn about their state as they collect and organize business information using State Facts for Students, a U.S. Census Bureau data tool. Students have the opportunity to examine data about kids their age, as well as a variety of other facts selected to appeal to young students. Students will create a bar graph to represent how the numbers of selected business types have changed between 2010 and 2016.
Published by OpenStax College, Collaborative Statistics was written by Barbara Illowsky and …
Published by OpenStax College, Collaborative Statistics was written by Barbara Illowsky and Susan Dean, faculty members at De Anza College in Cupertino, California. The textbook was developed over several years and has been used in regular and honors-level classroom settings and in distance learning classes. This textbook is intended for introductory statistics courses being taken by students at two and fouryear colleges who are majoring in fields other than math or engineering. Intermediate algebra is the only prerequisite. The book focuses on applications of statistical knowledge rather than the theory behind it.
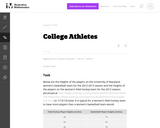
n this task, students are able to conjecture about the differences in …
n this task, students are able to conjecture about the differences in the two groups from a strictly visual perspective and then support their comparisons with appropriate measures of center and variability. This will reinforce that much can be gleaned simply from visual comparison of appropraite graphs, particularly those of similar scale. Students are also encouraged to consider how certain measurements and observation values from one group compare in the context of the other group.
Students will calculate various measures of central tendency using data on the …
Students will calculate various measures of central tendency using data on the number of people who bike to work in select states. Students will then create a box plot to represent the data set and answer conceptual questions about the impact of the data set’s outlier.
Students will compare data for two states using comparison symbols and both …
Students will compare data for two states using comparison symbols and both rounded and unrounded (exact) numbers. Students will then write their own question to compare the data.
No restrictions on your remixing, redistributing, or making derivative works. Give credit to the author, as required.
Your remixing, redistributing, or making derivatives works comes with some restrictions, including how it is shared.
Your redistributing comes with some restrictions. Do not remix or make derivative works.
Most restrictive license type. Prohibits most uses, sharing, and any changes.
Copyrighted materials, available under Fair Use and the TEACH Act for US-based educators, or other custom arrangements. Go to the resource provider to see their individual restrictions.