This course covers the analytical, graphical, and numerical methods supporting the analysis …
This course covers the analytical, graphical, and numerical methods supporting the analysis and design of integrated biological systems. Topics include modularity and abstraction in biological systems, mathematical encoding of detailed physical problems, numerical methods for solving the dynamics of continuous and discrete chemical systems, statistics and probability in dynamic systems, applied local and global optimization, simple feedback and control analysis, statistics and probability in pattern recognition.
Students will learn about the nature and importance of qualitative research as …
Students will learn about the nature and importance of qualitative research as a complement to numerical data — specifically how sociologists use in-depth ethnographic research to study specific places and groups. After students investigate census data on the demographics of their school’s ZIP code, they will observe a location at their school (e.g., a student center or cafeteria). Students will record their notes, understanding the importance of reflexivity in field research. Then they will write a short paper about their field study.
The applets in this section of Statistical Java allow you to see …
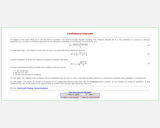
The applets in this section of Statistical Java allow you to see how levels of confidence are achieved through repeated sampling. The confidence intervals are related to the probability of successes in a Binomial experiment.
The applets in this section allow you to see how the common …
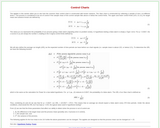
The applets in this section allow you to see how the common Xbar control chart is constructed with known variance. The Xbar chart is constructed by collecting a sample of size n at different times t.
The applets in this section allow you to see how different bivariate …
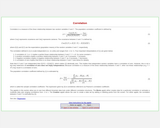
The applets in this section allow you to see how different bivariate data look under different correlation structures. The Movie applet either creates data for a particular correlation or animates a multitude data sets ranging correlations from -1 to 1.
The applet in this section allows for simple data analysis of univariate …
The applet in this section allows for simple data analysis of univariate data. Users can either generate normal or uniform data for k samples or copy and paste data from another source to a text box. A univariate analysis is performed for all k samples.
Our team of experts is excited to share with you their favorite …
Our team of experts is excited to share with you their favorite tips and tricks about how to access and use Census Bureau Data.
So we created the Data Gems: a series of "how-to" videos available for data users who are looking for an easy and quick way to enhance their knowledge of Census data.
They will introduce you to various concepts and techniques to improve your ability to navigate our website and use our data-access tools.
We hope you find these Gems valuable! Drop us a line at census.academy@census.gov and let us know what you think!
This is a task from the Illustrative Mathematics website that is one …
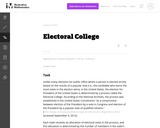
This is a task from the Illustrative Mathematics website that is one part of a complete illustration of the standard to which it is aligned. Each task has at least one solution and some commentary that addresses important aspects of the task and its potential use.
This is a task from the Illustrative Mathematics website that is one …
This is a task from the Illustrative Mathematics website that is one part of a complete illustration of the standard to which it is aligned. Each task has at least one solution and some commentary that addresses important aspects of the task and its potential use.
This course covers the design, construction, and testing of field robotic systems, …
This course covers the design, construction, and testing of field robotic systems, through team projects with each student responsible for a specific subsystem. Projects focus on electronics, instrumentation, and machine elements. Design for operation in uncertain conditions is a focus point, with ocean waves and marine structures as a central theme. Topics include basic statistics, linear systems, Fourier transforms, random processes, spectra, ethics in engineering practice, and extreme events with applications in design.
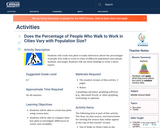
Students will create box plots to make inferences about the percentages of …
Students will create box plots to make inferences about the percentages of people who walk to work in cities of different population sizes (small, medium, and large). Students will use these findings to write a short report.
Students will develop, justify, and evaluate conjectures about the relationship between two …
Students will develop, justify, and evaluate conjectures about the relationship between two quantitative variables over time in the United States: the median age (in years) when women first marry and the percentage of women aged 25–34 with a bachelor’s degree or higher. Students will write a regression equation for the data, interpret in context the linear model’s slope and y-intercept, and find the correlation coefficient (r), assessing the strength of the linear relationship and whether a significant relationship exists between the variables. Students will then summarize their conclusions and consider whether correlation implies causation.
This task introduces the fundamental statistical ideas of using data summaries (statistics) …
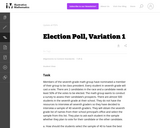
This task introduces the fundamental statistical ideas of using data summaries (statistics) from random samples to draw inferences (reasoned conclusions) about population characteristics (parameters). In the task built around an election poll scenario, the population is the entire seventh grade class, the unknown characteristic (parameter) of interest is the proportion of the class members voting for a specific candidate, and the sample summary (statistic) is the observed proportion of voters favoring the candidate in a random sample of class members.
This task introduces the fundamental statistical ideas of using data summaries (statistics) …
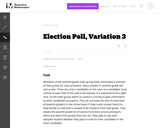
This task introduces the fundamental statistical ideas of using data summaries (statistics) from random samples to draw inferences (reasoned conclusions) about population characteristics (parameters). In the task built around an election poll scenario, the population is the entire seventh grade class, the unknown characteristic (parameter) of interest is the proportion of the class members voting for a specific candidate, and the sample summary (statistic) is the observed proportion of voters favoring the candidate in a random sample of class members.
This task introduces the fundamental statistical ideas of using data summaries (statistics) …
This task introduces the fundamental statistical ideas of using data summaries (statistics) from random samples to draw inferences (reasoned conclusions) about population characteristics (parameters). In the task built around an election poll scenario, the population is the entire seventh grade class, the unknown characteristic (parameter) of interest is the proportion of the class members voting for a specific candidate, and the sample summary (statistic) is the observed proportion of voters favoring the candidate in a random sample of class members.
n addition to providing a task that relates to other disciplines (history, …
n addition to providing a task that relates to other disciplines (history, civics, current events, etc.), this task is intended to demonstrate that a graph can summarize a distribution as well as provide useful information about specific observations.
The task is designed to show that random samples produce distributions of …
The task is designed to show that random samples produce distributions of sample means that center at the population mean, and that the variation in the sample means will decrease noticeably as the sample size increases. Random sampling (like mixing names in a hat and drawing out a sample) is not a new idea to most students, although the terminology is likely to be new.
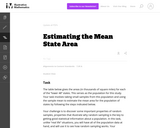
Learning Objectives: 1).Determine point estimates in simple cases, and make the connection …
Learning Objectives: 1).Determine point estimates in simple cases, and make the connection between the sampling distribution of a statistic, and its properties as a point estimator. 2). Explain what a confidence interval represents and determine how changes in sample size and confidence level affect the precision of the confidence interval. 3). Find confidence intervals for the population mean and the population proportion (when certain conditions are met), and perform sample size calculations.
Students will analyze and compare census data on the education levels of …
Students will analyze and compare census data on the education levels of African-Americans in 1850 and in 1880. Students will also discuss how historical events can affect data.
No restrictions on your remixing, redistributing, or making derivative works. Give credit to the author, as required.
Your remixing, redistributing, or making derivatives works comes with some restrictions, including how it is shared.
Your redistributing comes with some restrictions. Do not remix or make derivative works.
Most restrictive license type. Prohibits most uses, sharing, and any changes.
Copyrighted materials, available under Fair Use and the TEACH Act for US-based educators, or other custom arrangements. Go to the resource provider to see their individual restrictions.