CK-12 Advanced Probability and Statistics introduces students to basic topics in statistics …
CK-12 Advanced Probability and Statistics introduces students to basic topics in statistics and probability but finishes with the rigorous topics an advanced placement course requires. Includes visualizations of data, introduction to probability, discrete probability distribution, normal distribution, planning and conducting a study, sampling distributions, hypothesis testing, regression and correlation, Chi-Square, analysis of variance, and non-parametric statistics.
A work in progress, this FlexBook is an introduction to theoretical probability …
A work in progress, this FlexBook is an introduction to theoretical probability and data organization. Students learn about events, conditions, random variables, and graphs and tables that allow them to manage data.
This task provides a context to calculate discrete probabilities and represent them …
This task provides a context to calculate discrete probabilities and represent them on a bar graph. It could also be used to create a class activity where students gather, represent, and analyze data, running simulations of the random walk and recording and then displaying their results.
This is a task from the Illustrative Mathematics website that is one …
This is a task from the Illustrative Mathematics website that is one part of a complete illustration of the standard to which it is aligned. Each task has at least one solution and some commentary that addresses important aspects of the task and its potential use.
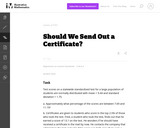
The purpose of this task is to have students complete normal distribution …
The purpose of this task is to have students complete normal distribution calculations and to use properties of normal distributions to draw conclusions. The task is designed to encourage students to communicate their findings in a narrative/report form in context Đ not just simply as a computed number.
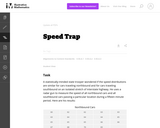
The purpose of this task is to allow students to demonstrate an …
The purpose of this task is to allow students to demonstrate an ability to construct boxplots and to use boxplots as the basis for comparing distributions. The solution should directly compare the center, spread, and shape of the two distributions and comment on the high outlier in the northbound data set.
In these activities designed to introduce sampling distributions and the Central Limit …
In these activities designed to introduce sampling distributions and the Central Limit Theorem, students generate several small samples and note patterns in the distributions of the means and proportions that they themselves calculate from these samples.
The activity is designed to help students develop a better intuitive understanding …
The activity is designed to help students develop a better intuitive understanding of what is meant by variability in statistics. Emphasis is placed on the standard deviation as a measure of variability. As they learn about the standard deviation, many students focus on the variability of bar heights in a histogram when asked to compare the variability of two distributions. For these students, variability refers to the variation in bar heights. Other students may focus only on the range of values, or the number of bars in a histogram, and conclude that two distributions are identical in variability even when it is clearly not the case. This activity can help students discover that the standard deviation is a measure of the density of values about the mean of a distribution and to become more aware of how clusters, gaps, and extreme values affect the standard deviation.
This course is an introduction to statistical data analysis. Topics are chosen …
This course is an introduction to statistical data analysis. Topics are chosen from applied probability, sampling, estimation, hypothesis testing, linear regression, analysis of variance, categorical data analysis, and nonparametric statistics.
This 8-minute video lesson takes problems from CK12.org to discuss using the …
This 8-minute video lesson takes problems from CK12.org to discuss using the Empirical Rule with a standard normal distribution. [Statistics playlist: Lesson 33 of 85]
This 10-minute video lesson takes some problems from CK12.org and uses the …
This 10-minute video lesson takes some problems from CK12.org and uses the empirical rule (or 68-95-99.7 rule) to estimate probabilities for normal distributions. [Statistics playlist: Lesson 32 of 85]
This 11-minute video lesson takes some problems from CK12.org and discusses of …
This 11-minute video lesson takes some problems from CK12.org and discusses of how "normal" a distribution might be. [Statistics playlist: Lesson 30 of 85]
This applet allows the user to adjust the degrees of freedom of …
This applet allows the user to adjust the degrees of freedom of the T Distribution with a slider or manual input. The applet allows the user to fix the x and or y axes. The user immediately sees how this affects the shape of the graph.
No restrictions on your remixing, redistributing, or making derivative works. Give credit to the author, as required.
Your remixing, redistributing, or making derivatives works comes with some restrictions, including how it is shared.
Your redistributing comes with some restrictions. Do not remix or make derivative works.
Most restrictive license type. Prohibits most uses, sharing, and any changes.
Copyrighted materials, available under Fair Use and the TEACH Act for US-based educators, or other custom arrangements. Go to the resource provider to see their individual restrictions.