Students will examine and interpret a population chart published in 1898 — …
Students will examine and interpret a population chart published in 1898 — depicting changes in the makeup of the United States across time in three categories, “foreign stock,” “native stock,” and “colored” — as well as an 1893 political cartoon about immigration. Students will also explain the causes and effects of population change in the late 19th century.
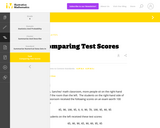
This is a task from the Illustrative Mathematics website that is one …
This is a task from the Illustrative Mathematics website that is one part of a complete illustration of the standard to which it is aligned. Each task has at least one solution and some commentary that addresses important aspects of the task and its potential use.
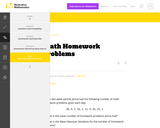
The students will use ACC basketball statistics to practice the process of …
The students will use ACC basketball statistics to practice the process of converting fractions to decimals then to percents and will learn how to create and edit a spreadsheet. They will then use this spreadsheet to analyze their data. This unit is done during the basketball season which takes approximately 15 weeks from the middle of November to the middle of March. Teachers must have Clarisworks to open the sample spreadsheet in the lesson, but may recreate it in another spreadsheet program.
This is a task from the Illustrative Mathematics website that is one …
This is a task from the Illustrative Mathematics website that is one part of a complete illustration of the standard to which it is aligned. Each task has at least one solution and some commentary that addresses important aspects of the task and its potential use.
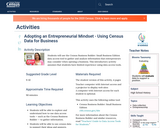
Students will use the Census Business Builder: Small Business Edition data access …
Students will use the Census Business Builder: Small Business Edition data access tool to gather and analyze information that entrepreneurs may consider when opening a business. This introductory activity assumes that students have limited experience using data access tools.
In this module, students reconnect with and deepen their understanding of statistics …
In this module, students reconnect with and deepen their understanding of statistics and probability concepts first introduced in Grades 6, 7, and 8. Students develop a set of tools for understanding and interpreting variability in data, and begin to make more informed decisions from data. They work with data distributions of various shapes, centers, and spreads. Students build on their experience with bivariate quantitative data from Grade 8. This module sets the stage for more extensive work with sampling and inference in later grades.
Find the rest of the EngageNY Mathematics resources at https://archive.org/details/engageny-mathematics.
Students will look at data showing how the “millennial” generation differs from …
Students will look at data showing how the “millennial” generation differs from other generations. They will analyze and evaluate social changes evident in the data. Then they will work with a partner to compose a newsletter.
Students will explore maps containing census data from 1950 through 2000. They …
Students will explore maps containing census data from 1950 through 2000. They will analyze how education levels and median household incomes have changed over time and determine how the two might be correlated. Students will also come up with ideas for policies that could help address issues related to income and education.
Students will read an informational text about variations in college completion rates …
Students will read an informational text about variations in college completion rates for people born in different years. To help students better understand the text, the teacher will model how to annotate the first half. Students will then annotate the second half themselves. After that, students will answer a series of questions about the text, drawing inferences from what they’ve read and citing textual evidence to support their responses.
Students will examine a table of 1850 Census data on employment to …
Students will examine a table of 1850 Census data on employment to understand the professions of free men across the United States at the time, calculating the percentages working in different industries. Students will also compare and contrast economies in the North and South during the Antebellum Period.
Students will use state and regional unemployment data for various education levels …
Students will use state and regional unemployment data for various education levels to create scatter plots and calculate correlation coefficients. Students will then compare scatter plots with different strengths of linear relationships and will determine the impact of any influential points on the correlation coefficient.
This learning video deals with a question of geometrical probability. A key …
This learning video deals with a question of geometrical probability. A key idea presented is the fact that a linear equation in three dimensions produces a plane. The video focuses on random triangles that are defined by their three respective angles. These angles are chosen randomly subject to a constraint that they must sum to 180 degrees. An example of the types of in-class activities for between segments of the video is: Ask six students for numbers and make those numbers the coordinates x,y of three points. Then have the class try to figure out how to decide if the triangle with those corners is acute or obtuse.
No restrictions on your remixing, redistributing, or making derivative works. Give credit to the author, as required.
Your remixing, redistributing, or making derivatives works comes with some restrictions, including how it is shared.
Your redistributing comes with some restrictions. Do not remix or make derivative works.
Most restrictive license type. Prohibits most uses, sharing, and any changes.
Copyrighted materials, available under Fair Use and the TEACH Act for US-based educators, or other custom arrangements. Go to the resource provider to see their individual restrictions.