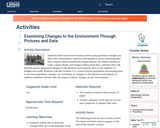
Students will examine how human actions and population changes can affect the …
Students will examine how human actions and population changes can affect the environment. Students will examine a series of photographs that compare famous landmarks (Times Square, the Saltair Pavilion in Utah, Laguna Beach, and Niagara Falls) across time, and then they will identify human-generated changes in the physical environment, such as the addition of bridges and roads. Students will also examine U.S. Census Bureau population and housing data to see how population changes can contribute to changes in the physical environment. In addition, students will describe the impact of these changes on the environment.
1). Summarize and describe the distribution of a categorical variable in context. …
1). Summarize and describe the distribution of a categorical variable in context. 2). Generate and interpret several different graphical displays of the distribution of a quantitative variable (histogram, stemplot, boxplot). 3). Summarize and describe the distribution of a quantitative variable in context: a) describe the overall pattern, b) describe striking deviations from the pattern. 4). Relate measures of center and spread to the shape of the distribution, and choose the appropriate measures in different contexts. 5). Compare and contrast distributions (of quantitative data) from two or more groups, and produce a brief summary, interpreting your findings in context. 5). Apply the standard deviation rule to the special case of distributions having the "normal" shape.
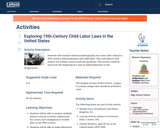
Students will examine historical photographs and a data table related to 19th-century …
Students will examine historical photographs and a data table related to 19th-century industrialization and child labor. They will observe and analyze the primary sources and ask questions. This activity could be used near the beginning of a unit on industrialization or the Progressives.
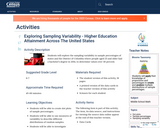
Students will explore the sampling variability in sample percentages of states and …
Students will explore the sampling variability in sample percentages of states and the District of Columbia where people aged 25 and older had a bachelor’s degree in 2014, to determine values over 30 percent.
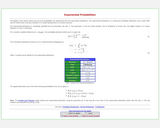
The applet in this section allows you see how probabilities are determined …
The applet in this section allows you see how probabilities are determined from the exponential distribution. The user determines the mean of the distribution and the limits of probability. Three different probability expressions are available.
Students will examine maps to explore changes in population density in the …
Students will examine maps to explore changes in population density in the United States during three decades: 1920–1930 (Post-Progressive Era), 1930–1940 (Great Depression), and 1940–1950 (World War II). They will then determine what happened during each decade that likely influenced geographic mobility. Students will also examine a map of more recent population data (for 2000–2010) to understand trends in population movement.
To introduce demographic characteristics to students, teachers will help them create a …
To introduce demographic characteristics to students, teachers will help them create a population pyramid. Then, students will use an online tool called QuickFacts to find census data on demographic characteristics for a county in 2017. They will compare it to older data from the same county to find changes and trends over time. They will then use QuickFacts to examine data about their school’s county. Students will use this information to help them understand how business owners and community leaders use data on demographic characteristics to make decisions.
Students will create and compare dot and box plots that show the …
Students will create and compare dot and box plots that show the percentages of single-mother and single-father households in different regions of the United States.
Students will use U.S. Census Bureau data to learn how population pyramids …
Students will use U.S. Census Bureau data to learn how population pyramids describe population structures and to calculate age range population percentages for a selected state that will help them create a population pyramid.
Students will collect, organize, and compare data about the number of girls …
Students will collect, organize, and compare data about the number of girls and the number of boys in their classroom who play sports, take lessons, and participate in clubs. Then students will compare these classroom data with U.S. Census Bureau data for girls and boys across the United States. Teachers may choose to adapt this activity for different data if other categories are more applicable to their students.
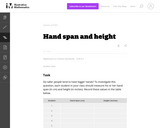
This task uses student generated data to assess standard 7.SP.7. This task …
This task uses student generated data to assess standard 7.SP.7. This task could also be extended to address Standard 7.SP.1 by adding a small or whole class discussion of whether the class could be considered as a representative sample of all students at your school.
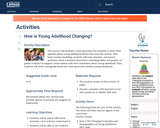
The teacher will facilitate a class discussion for students to share their …
The teacher will facilitate a class discussion for students to share their opinions about young adulthood before they start the activity. After some teacher modeling, students will read, annotate, and answer questions about a technical document—including tables and graphs—to gather evidence to support conversations with their classmates about young adulthood. Then, students will write a paragraph about how their generation defines young adulthood.
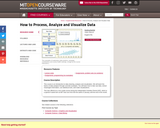
This course is an introduction to data cleaning, analysis and visualization. We …
This course is an introduction to data cleaning, analysis and visualization. We will teach the basics of data analysis through concrete examples. You will learn how to take raw data, extract meaningful information, use statistical tools, and make visualizations. This was offered as a non-credit course during the Independent Activities Period (IAP), which is a special 4-week term at MIT that runs from the first week of January until the end of the month.
Students will analyze census data and graphs that demonstrate how certain aspects …
Students will analyze census data and graphs that demonstrate how certain aspects of the lives of African-Americans have changed since civil rights leader Martin Luther King Jr. delivered his “I Have a Dream” speech in 1963. Students will select a fact from these data, facts from other sources, and a historical photograph to include on a poster about King.
This is a task from the Illustrative Mathematics website that is one …
This is a task from the Illustrative Mathematics website that is one part of a complete illustration of the standard to which it is aligned. Each task has at least one solution and some commentary that addresses important aspects of the task and its potential use.
Students will examine data on the number of immigrants in the United …
Students will examine data on the number of immigrants in the United States, to create bar graphs and line graphs with appropriate scales. Students will then compare and analyze their graphs to draw conclusions about the data.
Students will examine population density maps of the United States during the …
Students will examine population density maps of the United States during the 1800s. They will learn about the Louisiana Purchase in 1803 to make and evaluate predictions about the changes in population density that resulted from this event, identifying shifts in boundaries and in areas of population density, and drawing conclusions. Students will then write a paragraph summarizing the impact of the Louisiana Purchase on the United States.
No restrictions on your remixing, redistributing, or making derivative works. Give credit to the author, as required.
Your remixing, redistributing, or making derivatives works comes with some restrictions, including how it is shared.
Your redistributing comes with some restrictions. Do not remix or make derivative works.
Most restrictive license type. Prohibits most uses, sharing, and any changes.
Copyrighted materials, available under Fair Use and the TEACH Act for US-based educators, or other custom arrangements. Go to the resource provider to see their individual restrictions.