This task addresses many standards regarding the description and analysis of bivariate …
This task addresses many standards regarding the description and analysis of bivariate quantitative data, including regression and correlation. Students should recognize that the pattern shown is one of a strong, positive, linear association, and thus a correlation coefficient value near +1 is plausible. Students should also be able to interpret the slope of the least-squares line as an estimated increase in y per unit change in x (and thus for a 3 unit increase in x, students should expect an estimated increase in y that equals 3 times the model's slope value).
: Fundamental mathematics for adult learners. Book 5 includes a Table of …
: Fundamental mathematics for adult learners. Book 5 includes a Table of Contents, Glossary, Grades Records, Self Tests, Practice Tests and Unit Tests. Ancillary Resources include the Instructor's Manual. This is 1 of a series of 6 books in the ABE Math collection.
Students will explore maps containing census data from 1950 through 2000. They …
Students will explore maps containing census data from 1950 through 2000. They will analyze how education levels and median household incomes have changed over time and determine how the two might be correlated. Students will also come up with ideas for policies that could help address issues related to income and education.
Students will examine a table of 1850 Census data on employment to …
Students will examine a table of 1850 Census data on employment to understand the professions of free men across the United States at the time, calculating the percentages working in different industries. Students will also compare and contrast economies in the North and South during the Antebellum Period.
Students will use state and regional unemployment data for various education levels …
Students will use state and regional unemployment data for various education levels to create scatter plots and calculate correlation coefficients. Students will then compare scatter plots with different strengths of linear relationships and will determine the impact of any influential points on the correlation coefficient.
Students will learn about the nature and importance of qualitative research as …
Students will learn about the nature and importance of qualitative research as a complement to numerical data — specifically how sociologists use in-depth ethnographic research to study specific places and groups. After students investigate census data on the demographics of their school’s ZIP code, they will observe a location at their school (e.g., a student center or cafeteria). Students will record their notes, understanding the importance of reflexivity in field research. Then they will write a short paper about their field study.
Students will develop, justify, and evaluate conjectures about the relationship between two …
Students will develop, justify, and evaluate conjectures about the relationship between two quantitative variables over time in the United States: the median age (in years) when women first marry and the percentage of women aged 25–34 with a bachelor’s degree or higher. Students will write a regression equation for the data, interpret in context the linear model’s slope and y-intercept, and find the correlation coefficient (r), assessing the strength of the linear relationship and whether a significant relationship exists between the variables. Students will then summarize their conclusions and consider whether correlation implies causation.
Students will examine maps to explore changes in population density in the …
Students will examine maps to explore changes in population density in the United States during three decades: 1920–1930 (Post-Progressive Era), 1930–1940 (Great Depression), and 1940–1950 (World War II). They will then determine what happened during each decade that likely influenced geographic mobility. Students will also examine a map of more recent population data (for 2000–2010) to understand trends in population movement.
This is course material published for a secondary Math 1 course. Authors of …
This is course material published for a secondary Math 1 course. Authors of this work are: Scott Hendrickson, Joleigh Honey, Barbara Kuehl, Travis Lemon, Janet Sutorius and updated from the original work in 2013 in partnership with the Utah State Office of Education.
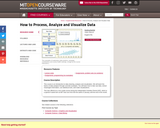
This course is an introduction to data cleaning, analysis and visualization. We …
This course is an introduction to data cleaning, analysis and visualization. We will teach the basics of data analysis through concrete examples. You will learn how to take raw data, extract meaningful information, use statistical tools, and make visualizations. This was offered as a non-credit course during the Independent Activities Period (IAP), which is a special 4-week term at MIT that runs from the first week of January until the end of the month.
Elementary introduction with applications. Basic probability models. Combinatorics. Random variables. Discrete and …
Elementary introduction with applications. Basic probability models. Combinatorics. Random variables. Discrete and continuous probability distributions. Statistical estimation and testing. Confidence intervals. Introduction to linear regression.
" This course will provide a solid foundation in probability and statistics …
" This course will provide a solid foundation in probability and statistics for economists and other social scientists. We will emphasize topics needed for further study of econometrics and provide basic preparation for 14.32. Topics include elements of probability theory, sampling theory, statistical estimation, and hypothesis testing."
The book "Introductory Business Statistics" by Thomas K. Tiemann explores the basic …
The book "Introductory Business Statistics" by Thomas K. Tiemann explores the basic ideas behind statistics, such as populations, samples, the difference between data and information, and most importantly sampling distributions. The author covers topics including descriptive statistics and frequency distributions, normal and t-distributions, hypothesis testing, t-tests, f-tests, analysis of variance, non-parametric tests, and regression basics. Using real-world examples throughout the text, the author hopes to help students understand how statistics works, not just how to "get the right number."
This Flash based applet simulates data from a case study of treatments …
This Flash based applet simulates data from a case study of treatments for tumor growth in mice. This simulation allows the user to place mice into a control and treatment groups.
This course covers the fundamentals of mathematical analysis: convergence of sequences and …
This course covers the fundamentals of mathematical analysis: convergence of sequences and series, continuity, differentiability, Riemann integral, sequences and series of functions, uniformity, and the interchange of limit operations. It shows the utility of abstract concepts and teaches an understanding and construction of proofs. MIT students may choose to take one of three versions of Real Analysis; this version offers three additional units of credit for instruction and practice in written and oral presentation.The three options for 18.100:Option A (18.100A) chooses less abstract definitions and proofs, and gives applications where possible.Option B (18.100B) is more demanding and for students with more mathematical maturity; it places more emphasis from the beginning on point-set topology and n-space, whereas Option A is concerned primarily with analysis on the real line, saving for the last weeks work in 2-space (the plane) and its point-set topology.Option C (18.100C) is a 15-unit variant of Option B, with further instruction and practice in written and oral communication. This fulfills the MIT CI requirement.
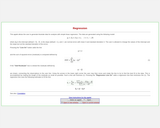
This applet from Statistical Java allows the user to generate bivariate data …
This applet from Statistical Java allows the user to generate bivariate data for analysis with simple linear regression. The page describes the equations used to generate the data and estimate the regression lines.
This course is an introduction to statistical data analysis. Topics are chosen …
This course is an introduction to statistical data analysis. Topics are chosen from applied probability, sampling, estimation, hypothesis testing, linear regression, analysis of variance, categorical data analysis, and nonparametric statistics.
This course is a broad treatment of statistics, concentrating on specific statistical …
This course is a broad treatment of statistics, concentrating on specific statistical techniques used in science and industry. Topics include: hypothesis testing and estimation, confidence intervals, chi-square tests, nonparametric statistics, analysis of variance, regression, correlation, decision theory, and Bayesian statistics.
No restrictions on your remixing, redistributing, or making derivative works. Give credit to the author, as required.
Your remixing, redistributing, or making derivatives works comes with some restrictions, including how it is shared.
Your redistributing comes with some restrictions. Do not remix or make derivative works.
Most restrictive license type. Prohibits most uses, sharing, and any changes.
Copyrighted materials, available under Fair Use and the TEACH Act for US-based educators, or other custom arrangements. Go to the resource provider to see their individual restrictions.