Acting as civil engineers hired by the U.S. Department of Transportation to …
Acting as civil engineers hired by the U.S. Department of Transportation to research how to best use piezoelectric materials to detect road damage, student groups are challenged to independently create their own experiment procedures, working with given materials and tools. The general approach is that they set up model roads using rubber mats to simulate asphalt and piezoelectric transducers to simulate the in-ground road sensors. They drop heavy bolts at various locations on the “road,” collecting data and then analyzing the voltage changes across the piezoelectric transducers caused by the vibrations of the bolt hitting the rubber. After making notches in the rubber “road” to simulate cracks and potholes, they collect more data to see if the piezo elements detect the damage. Students write up their research and conclusions as if presenting evidence to USDOT officials about how the voltage changes across the piezo elements can be used to indicate road damage and extrapolated to determine when roads need maintenance service.
This page of Statistical Java describes 11 different probability distributions including the …
This page of Statistical Java describes 11 different probability distributions including the Binomial, Poisson, Negative Binomial, Geometric, T, Chi-squared, Gamma, Weibull, Log-Normal, Beta, and F. Each distribution has its own applet.
CK-12 Advanced Probability and Statistics introduces students to basic topics in statistics …
CK-12 Advanced Probability and Statistics introduces students to basic topics in statistics and probability but finishes with the rigorous topics an advanced placement course requires. Includes visualizations of data, introduction to probability, discrete probability distribution, normal distribution, planning and conducting a study, sampling distributions, hypothesis testing, regression and correlation, Chi-Square, analysis of variance, and non-parametric statistics.
A work in progress, this FlexBook is an introduction to theoretical probability …
A work in progress, this FlexBook is an introduction to theoretical probability and data organization. Students learn about events, conditions, random variables, and graphs and tables that allow them to manage data.
Quantitative analysis of uncertainty and risk for engineering applications. Fundamentals of probability, …
Quantitative analysis of uncertainty and risk for engineering applications. Fundamentals of probability, random processes, statistics, and decision analysis. Random variables and vectors, uncertainty propagation, conditional distributions, and second-moment analysis. Introduction to system reliability. Bayesian analysis and risk-based decision. Estimation of distribution parameters, hypothesis testing, and simple and multiple linear regressions. Poisson and Markov processes. Emphasis on application to engineering problems.
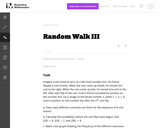
This task provides a context to calculate discrete probabilities and represent them …
This task provides a context to calculate discrete probabilities and represent them on a bar graph. It could also be used to create a class activity where students gather, represent, and analyze data, running simulations of the random walk and recording and then displaying their results.
This is a task from the Illustrative Mathematics website that is one …
This is a task from the Illustrative Mathematics website that is one part of a complete illustration of the standard to which it is aligned. Each task has at least one solution and some commentary that addresses important aspects of the task and its potential use.
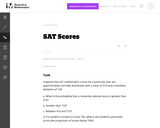
The purpose of this task is to have students complete normal distribution …
The purpose of this task is to have students complete normal distribution calculations and to use properties of normal distributions to draw conclusions. The task is designed to encourage students to communicate their findings in a narrative/report form in context Đ not just simply as a computed number.
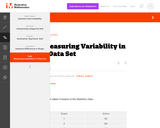
The purpose of this task is to allow students to demonstrate an …
The purpose of this task is to allow students to demonstrate an ability to construct boxplots and to use boxplots as the basis for comparing distributions. The solution should directly compare the center, spread, and shape of the two distributions and comment on the high outlier in the northbound data set.
In these activities designed to introduce sampling distributions and the Central Limit …
In these activities designed to introduce sampling distributions and the Central Limit Theorem, students generate several small samples and note patterns in the distributions of the means and proportions that they themselves calculate from these samples.
This course is an introduction to statistical data analysis. Topics are chosen …
This course is an introduction to statistical data analysis. Topics are chosen from applied probability, sampling, estimation, hypothesis testing, linear regression, analysis of variance, categorical data analysis, and nonparametric statistics.
This 8-minute video lesson takes problems from CK12.org to discuss using the …
This 8-minute video lesson takes problems from CK12.org to discuss using the Empirical Rule with a standard normal distribution. [Statistics playlist: Lesson 33 of 85]
This 10-minute video lesson takes some problems from CK12.org and uses the …
This 10-minute video lesson takes some problems from CK12.org and uses the empirical rule (or 68-95-99.7 rule) to estimate probabilities for normal distributions. [Statistics playlist: Lesson 32 of 85]
This 11-minute video lesson takes some problems from CK12.org and discusses of …
This 11-minute video lesson takes some problems from CK12.org and discusses of how "normal" a distribution might be. [Statistics playlist: Lesson 30 of 85]
This applet allows the user to adjust the degrees of freedom of …
This applet allows the user to adjust the degrees of freedom of the T Distribution with a slider or manual input. The applet allows the user to fix the x and or y axes. The user immediately sees how this affects the shape of the graph.
This is a task from the Illustrative Mathematics website that is one …
This is a task from the Illustrative Mathematics website that is one part of a complete illustration of the standard to which it is aligned. Each task has at least one solution and some commentary that addresses important aspects of the task and its potential use.
No restrictions on your remixing, redistributing, or making derivative works. Give credit to the author, as required.
Your remixing, redistributing, or making derivatives works comes with some restrictions, including how it is shared.
Your redistributing comes with some restrictions. Do not remix or make derivative works.
Most restrictive license type. Prohibits most uses, sharing, and any changes.
Copyrighted materials, available under Fair Use and the TEACH Act for US-based educators, or other custom arrangements. Go to the resource provider to see their individual restrictions.