
This Unit is Transdisciplinary reinforcing the importance of the honeybee.
- Subject:
- Applied Science
- Environmental Science
- Life Science
- Mathematics
- Material Type:
- Activity/Lab
- Author:
- Cindy Rizzolino
- Date Added:
- 05/13/2021

This Unit is Transdisciplinary reinforcing the importance of the honeybee.
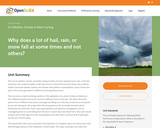
This unit on weather, climate, and water cycling is broken into four separate lesson sets. In the first two lesson sets, students explain small-scale storms. In the third and fourth lesson sets, students explain mesoscale weather systems and climate-level patterns of precipitation. Each of these two parts of the unit is grounded in a different anchoring phenomenon.
The unit starts out with anchoring students in the exploration of a series of videos of hailstorms from different locations across the country at different times of the year. The videos show that pieces of ice of different sizes (some very large) are falling out of the sky, sometimes accompanied by rain and wind gusts, all on days when the temperature of the air outside remained above freezing for the entire day. These cases spark questions and ideas for investigations, such as investigating how ice can be falling from the sky on a warm day, how clouds form, why some clouds produce storms with large amounts of precipitation and others don’t, and how all that water gets into the air in the first place.
The second half of the unit is anchored in the exploration of a weather report of a winter storm that affected large portions of the midwestern United States. The maps, transcripts, and video that students analyze show them that the storm was forecasted to produce large amounts of snow and ice accumulation in large portions of the northeastern part of the country within the next day. This case sparks questions and ideas for investigations around trying to figure out what could be causing such a large-scale storm and why it would end up affecting a different part of the country a day later.
In this part of the unit, students are exploring how global temperatures have changed over the past hundred years. Students will examine tables and graphs about global temperatures and carbon dioxide levels, human consumption of food, and human consumption of natural resources. They will find patterns in the graphs. Based on this data, students will construct an argument about how human activities (increase in population and consumption of natural resources) cause global temperatures to increase.
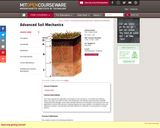
This class presents the application of principles of soil mechanics. It considers the following topics: the origin and nature of soils; soil classification; the effective stress principle; hydraulic conductivity and seepage; stress-strain-strength behavior of cohesionless and cohesive soils and application to lateral earth stresses; bearing capacity and slope stability; consolidation theory and settlement analyses; and laboratory and field methods for evaluation of soil properties in design practice.
In this lesson, students are introduced to global climate change. They explore the ramifications of global climate change for Michigan, as well as individual actions that
can decrease greenhouse gas (GHG) emissions.
This lesson looks at the sources of air pollutants. Students examine the sources of air pollutants (point, mobile, area, and natural) using charts of actual data for Michigan. The
concept of an airshed and its importance for understanding air pollution is developed.
Students learn about the gases and particles that make up the air and explore different ways that we can monitor pollutants. Students monitor particle and ozone pollution
around their school/homes using homemade monitors.
In this lesson, the Internet is used as a resource for students to access daily (and hourly) information about air quality. The National Air Quality Index provides color-coded information about levels of air pollution and health effects. The color codes of the AQI, posted daily, can be found on the Internet and in some newspapers. The UV index alerts people to levels of ultraviolet radiation from the sun. Students use the Internet to find out about the UV index in Michigan and around the country.
In this lesson, the Internet is used as a resource for students to access daily (and hourly) information about air quality.
In this lesson, students explore the role of regulations in influencing air quality decisions as they examine trends in air pollution. The students are encouraged to think
critically about important technological developments that have influenced the lives of individuals since the start of the twentieth century.
In this lesson, students explore the role of regulations ininfluencing air quality decisions as they examine trendsin air pollution. The students are encouraged to thinkcritically about important technological developments thathave influenced the lives of individuals since the start ofthe twentieth century.
Students explore how public policy decisions are made and practice solving problems that require choices. Students learn that solving environmental issues involves a
diversity of stakeholders and that everyone can contribute to solutions to air pollution problems.
The lesson develops the basic ideas that combustion activities are a major source of air pollution and that the products of combustion include particles (soot) and gases such as
carbon monoxide and carbon dioxide.
This lesson feature allows students to explore the relationship between air pollution
and asthma in Michigan.
Investigate characteristics of major biomes and examine the impact of land-use changes as the result of human activities.
GeoInquiries are designed to be fast and easy-to-use instructional resources that incorporate advanced web mapping technology. Each 15-minute activity in a collection is intended to be presented by the instructor from a single computer/projector classroom arrangement. No installation, fees, or logins are necessary to use these materials and software.

A Nearpod lesson about observing animals in your community.

This course details the quantitative treatment of chemical processes in aquatic systems such as lakes, oceans, rivers, estuaries, groundwaters, and wastewaters. It includes a brief review of chemical thermodynamics that is followed by discussion of acid-base, precipitation-dissolution, coordination, and reduction-oxidation reactions. Emphasis is on equilibrium calculations as a tool for understanding the variables that govern the chemical composition of aquatic systems and the fate of inorganic pollutants.

This lesson deals with human growth and our consumption of land resources. This lesson can be used in conjunction with other Are We Our Own Worst Enemy? lessons, although this should be first since it has the video of population growth. This lesson results from a collaboration between the Alabama State Department of Education and ASTA.
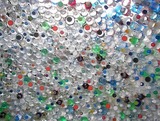
The purpose of this Roadmap is work on the Science and Engineering Practices—specifically engaging in argument from evidence and obtaining, evaluating, and communicating information. During this roadmap students will synthesize information from several articles about plastics and the environment and the role regulation plays in our communities. At the end of their research students are expected to write an opinion essay answering the question: Should we ban plastics?.
This opinion piece is also an opportunity for students to practice writing in Claim-Evidence-Reasoning. As an extension, students can then engage in a debate but this is optional based on time constraints and how ‘in depth’ you want this to be for your students.
Overall expect this to take several days 2 for research and synthesis, 1 to write their papers, and then additional time for debate.
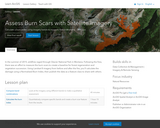
In this project, you'll assume the role of a geospatial scientist working with the Montana Forestry Department to analyze the damage in Glacier National Park. You'll first compare Landsat 8 imagery from before and after the fires. Then, you'll change the band combination of the post-fire imagery in order to emphasize burn scars and make a qualitative judgment. Afterward, you'll quantify your assessment by calculating a Normalized Burn Index (a ratio designed to highlight burned areas) from the imagery. Lastly, you'll create a feature class to represent the burn scar, calculate its acreage, and publish it to ArcGIS Online to share with the department.