Submitted as part of the California Learning Resource Network (CLRN) Phase 3 …
Submitted as part of the California Learning Resource Network (CLRN) Phase 3 Digital Textbook Initiative (CA DTI3), CK-12 Advanced Probability and Statistics introduces students to basic topics in statistics and probability but finishes with the rigorous topics an advanced placement course requires. Includes visualizations of data, introduction to probability, discrete probability distribution, normal distribution, planning and conducting a study, sampling distributions, hypothesis testing, regression and correlation, Chi-Square, analysis of variance, and non-parametric statistics.
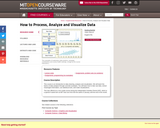
This course is an introduction to data cleaning, analysis and visualization. We …
This course is an introduction to data cleaning, analysis and visualization. We will teach the basics of data analysis through concrete examples. You will learn how to take raw data, extract meaningful information, use statistical tools, and make visualizations. This was offered as a non-credit course during the Independent Activities Period (IAP), which is a special 4-week term at MIT that runs from the first week of January until the end of the month.
How did scientists figure out the structure of atoms without looking at …
How did scientists figure out the structure of atoms without looking at them? Try out different models by shooting light at the atom. Check how the prediction of the model matches the experimental results.
CK-12 Foundation's new and improved Advanced Probability and Statistics-Second Edition FlexBook introduces …
CK-12 Foundation's new and improved Advanced Probability and Statistics-Second Edition FlexBook introduces students to basic topics in statistics and probability, but finishes with the rigorous topics an advanced placement course requires.
CK-12 Foundation's Basic Probability and Statistics - A Short Course is an …
CK-12 Foundation's Basic Probability and Statistics - A Short Course is an introduction to theoretical probability and data organization. Students learn about events, conditions, random variables, and graphs and tables that allow them to manage data.
During the early days of the coronavirus pandemic, we all made sacrifices …
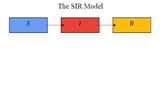
During the early days of the coronavirus pandemic, we all made sacrifices to slow the spread of the virus and to flatten the curve of infections.The curve itself appears in the susceptible-infected-recovered (SIR) model – a simple epidemiological model that explains some of the basic dynamics of infectious disease. Curve-flattening effects of mitigation measures such as social distancing, mask wearing, and hand washing can be seen in the dynamics of the SIR model as can the phenomenon of herd-immunity.In this activity, students are encouraged to derive the SIR model from scratch and to explore dynamical features of the model such as curve flattening and herd immunity.These resources were created by Dr. Robert Kipka of Lake Superior State University. They are intended for high school students and teachers. Calculus or familiarity with families of functions such as logarithms is not required. However, in spite of the relatively modest mathematical background called for, this activity may be challenging.It may help to complete the Three Weeks in March activity before beginning.
A whirl-wind tour of the statistics used in behavioral science research, covering …
A whirl-wind tour of the statistics used in behavioral science research, covering topics including: data visualization, building your own null-hypothesis distribution through permutation, useful parametric distributions, the generalized linear model, and model-based analyses more generally. Familiarity with MATLABA, Octave, or R will be useful, prior experience with statistics will be helpful but is not essential. This course is intended to be a ground-up sketch of a coherent, alternative perspective to the "null-hypothesis significance testing" method for behavioral research (but don't worry if you don't know what this means).
Three Weeks in March is a data-driven approach to modeling the spread of …
Three Weeks in March is a data-driven approach to modeling the spread of coronavirus cases in the United States.In this activity, students will use a difference equation to model day-to-day changes in the known cases of coronavirus within U.S. borders, as reported by the Centers for Disease Control and Prevention, during the first three weeks of March, 2020. The solution to this difference equation is an exponential model. The activity can serve as an introduction to exponential models.The main goals of this activity are to:Learn the idea of difference equation;Model exponential growth using a difference equation;Simulate exponential growth and estimate a parameter value using software.These resources were created by Dr. Rob Kipka of Lake Superior State University.
No restrictions on your remixing, redistributing, or making derivative works. Give credit to the author, as required.
Your remixing, redistributing, or making derivatives works comes with some restrictions, including how it is shared.
Your redistributing comes with some restrictions. Do not remix or make derivative works.
Most restrictive license type. Prohibits most uses, sharing, and any changes.
Copyrighted materials, available under Fair Use and the TEACH Act for US-based educators, or other custom arrangements. Go to the resource provider to see their individual restrictions.