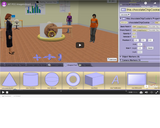
Interactive video showing how to add images and use them as billboards in Alice.
- Subject:
- Applied Science
- Computer Science
- Material Type:
- Interactive
- Provider:
- Michigan Virtual
- Date Added:
- 12/11/2018

Interactive video showing how to add images and use them as billboards in Alice.
Students have a discussion on the different levels of security they would like for personal data. Once the class has developed an understanding of the importance of privacy, they learn about the process of encrypting information by enciphering a note for a partner and deciphering the partner's note. The class concludes with a discussion about the importance of both physical and digital security.
It is finally time for students to take on the Explore Performance Task. For a minimum of 8 class hours, students should work on their projects with only types of teacher support allowed (essentially: Advise on process, don’t influence or evaluate ideas).
The lesson includes reminders about how you can interact with students while they are working on their projects, and suggestions about time line. The Explore PT requires a minimum of 8 hours of class time. At the end, students will submit their computational artifact and written responses through their AP digital portfolio.
This is a pretty fun lesson that has two main parts. First students warm up by reflecting on the reasons data visualizations are used to communicate about data. This leads to the main activity in which students look at some collections of (mostly bad) data visualizations, rate them, explain why a good one is effective, and also suggest a fix for a bad one.
In the second part of class students compare their experiences and create a class list of common faults and best practices for creating data visualizations. Finally, students review and read the first few pages of **Data Visualization 101: How to design charts and graphs** to see some basic principles of good data visualizations and see how they compare with the list the class came up with.
For this Practice PT students will analyze the data that they have been collecting as a class in order to demonstrate their ability to discover, visualize, and present a trend or pattern they find in the data. Leading up to this lesson, students will have been working in pairs to clean and summarize their data. Students should complete this project individually but can get feedback on their ideas from their data-cleaning partner.
**Note**: This is NOT the official AP® Performance Task that will be submitted as part of the Advanced Placement exam; it is a practice activity intended to prepare students for some portions of their individual performance at a later time.

Dialog cards presenting the data storage terminology

Exploring Computer Science is a yearlong course developed around a framework of both computer science content and computational practice. Assignments and instruction are contextualized to be socially relevant and meaningful for diverse students. Units utilize a variety of tools/platforms and culminate with final projects around Human-Computer Interaction, Problem Solving, Web Design (HTML, CSS), Programming (Scratch, Edware), Computing & Data Analysis, and Robotics. ECS is recognized nationally as a preparatory course for AP Computer Science Principles. Watch this video and view this fact sheet for more information.

This is the story of how Les Paul created the world's first solid-body electric guitar, countless other inventions that changed modern music, and one truly epic career in rock and roll. How to make a microphone? A broomstick, a cinderblock, a telephone, a radio. How to make an electric guitar? A record player's arm, a speaker, some tape. How to make a legendary inventor? A few tools, a lot of curiosity, and an endless faith in what is possible, this unforgettable biography will resonate with inventive readers young and old.
These days Artificial Intelligence and Machine Learning are all the craze, but have you ever wondered how in the world is it really possible to teach a machine to learn something, anything really, and become, well, artificially intelligent? In this project, using the context of one of the simplest children's games, Rock-Paper-Scissors, you are challenged to create a program that allows the machine to observe and learn from its user's game choices using a Markov Model to quickly become intelligent enough to repeatedly beat the user at the game.

Three Weeks in March is a data-driven approach to modeling the spread of coronavirus cases in the United States.In this activity, students will use a difference equation to model day-to-day changes in the known cases of coronavirus within U.S. borders, as reported by the Centers for Disease Control and Prevention, during the first three weeks of March, 2020. The solution to this difference equation is an exponential model. The activity can serve as an introduction to exponential models.The main goals of this activity are to:Learn the idea of difference equation;Model exponential growth using a difference equation;Simulate exponential growth and estimate a parameter value using software.These resources were created by Dr. Rob Kipka of Lake Superior State University.