This is a task from the Illustrative Mathematics website that is one …
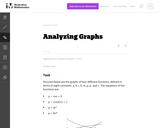
This is a task from the Illustrative Mathematics website that is one part of a complete illustration of the standard to which it is aligned. Each task has at least one solution and some commentary that addresses important asects of the task and its potential use. Here are the first few lines of the commentary for this task: Pictured below are the graphs of four different functions, defined in terms of eight constants: $a, b, c, k, m, p, q, \text{ and } r.$ The equations of...
This is a task from the Illustrative Mathematics website that is one …
This is a task from the Illustrative Mathematics website that is one part of a complete illustration of the standard to which it is aligned. Each task has at least one solution and some commentary that addresses important asects of the task and its potential use. Here are the first few lines of the commentary for this task: In 1901, the San Francisco mint produced only 72,664 quarters. By comparison, during other years around the turn of the century they made between 1 mil...
This is a task from the Illustrative Mathematics website that is one …
This is a task from the Illustrative Mathematics website that is one part of a complete illustration of the standard to which it is aligned. Each task has at least one solution and some commentary that addresses important asects of the task and its potential use. Here are the first few lines of the commentary for this task: SCREEN I In science class, some students dropped a basketball and allowed it to bounce. They measured and recorded the highest point of each bounce. ht...
This is a task from the Illustrative Mathematics website that is one …
This is a task from the Illustrative Mathematics website that is one part of a complete illustration of the standard to which it is aligned. Each task has at least one solution and some commentary that addresses important asects of the task and its potential use. Here are the first few lines of the commentary for this task: Below is a table showing the approximate boiling point of water at different elevations: Elevation (meters above sea level)Boiling Point (degrees Celsi...
This is a task from the Illustrative Mathematics website that is one …
This is a task from the Illustrative Mathematics website that is one part of a complete illustration of the standard to which it is aligned. Each task has at least one solution and some commentary that addresses important asects of the task and its potential use. Here are the first few lines of the commentary for this task: Below are population estimates for the larger metropolitan areas of Paris (France), Shenzhen (China), and Lagos (Nigeria) for each decade between 1950 ...
This is a task from the Illustrative Mathematics website that is one …
This is a task from the Illustrative Mathematics website that is one part of a complete illustration of the standard to which it is aligned. Each task has at least one solution and some commentary that addresses important asects of the task and its potential use. Here are the first few lines of the commentary for this task: How do the values of the three functions $f(x) = 2x$, $g(x) = x^2$ and $h(x) = 2^x$ compare for large positive and negative values of $x$? Explain your...
This is a task from the Illustrative Mathematics website that is one …
This is a task from the Illustrative Mathematics website that is one part of a complete illustration of the standard to which it is aligned. Each task has at least one solution and some commentary that addresses important asects of the task and its potential use. Here are the first few lines of the commentary for this task: According to ancient legend, Dido made a deal with a local ruler to obtain as much land as she could cover with an oxhide. Dido interpreted ''cover'' i...
This is a task from the Illustrative Mathematics website that is one …
This is a task from the Illustrative Mathematics website that is one part of a complete illustration of the standard to which it is aligned. Each task has at least one solution and some commentary that addresses important aspects of the task and its potential use.
In this task students have the opportunity to construct linear and exponential …
In this task students have the opportunity to construct linear and exponential functions, including arithmetic and geometric sequences, given a graph, a description of a relationship, or two input-output pairs (include reading these from a table).
In this seminar you will learn how to graph quadratic functions and …
In this seminar you will learn how to graph quadratic functions and how to use these graphs to identify the roots, or solutions, of the function. You will learn how to use different arrangements of the equation in order to locate specific, important points for the graph. You will also learn why the intercepts of the function translate to solutions of the equation. Standards CC.2.2.HS.C.5 Construct and compare linear, quadratic, and exponential models to solve problems,
This is a community contributed High School Equivalency Algebra textbook, focused on …
This is a community contributed High School Equivalency Algebra textbook, focused on algebra material for the GED(R) math test. Use as is, or download and modify to your heart's content. Covers integers to functions.
This is course material published for a secondary Math 1 course. Authors of …
This is course material published for a secondary Math 1 course. Authors of this work are: Scott Hendrickson, Joleigh Honey, Barbara Kuehl, Travis Lemon, Janet Sutorius and updated from the original work in 2013 in partnership with the Utah State Office of Education.
In the middle grades, students have lots of experience analyzing and comparing …
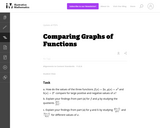
In the middle grades, students have lots of experience analyzing and comparing linear functions using graphs, tables, symbolic expressions, and verbal descriptions. In this task, students may choose a representation that suits them and then reason from within that representation.
This is an opportunity for pupils to set up their own models …
This is an opportunity for pupils to set up their own models using a spreadsheet and investigate what happens when they change variables such as interest, inflation rates and how much is spent each year. Investigating how a small change in interest rates can affect the total income over different time periods can be enlightening. Investigating the impact of spending large amounts of money up-front can also provide valuable insights.
Students groups act as aerospace engineering teams competing to create linear equations …
Students groups act as aerospace engineering teams competing to create linear equations to guide space shuttles safely through obstacles generated by a modeling game in level-based rounds. Each round provides a different configuration of the obstacle, which consists of two "gates." The obstacles are presented as asteroids or comets, and the linear equations as inputs into autopilot on board the shuttle. The winning group is the one that first generates the successful equations for all levels. The game is created via the programming software MATLAB, available as a free 30-day trial. The activity helps students make the connection between graphs and the real world. In this activity, they can see the path of a space shuttle modeled by a linear equation, as if they were looking from above.
Students complete an exercise showing logarithmic relationships and examine how to find …
Students complete an exercise showing logarithmic relationships and examine how to find the linear regression of data that does not seem linear upon initial examination. They relate number of BMD scanners to time.
CK-12 Foundation's Middle School Math Grade 6 Flexbook covers the fundamentals …
CK-12 Foundation's Middle School Math Grade 6 Flexbook covers the fundamentals of fractions, decimals, and geometry. Also explored are units of measurement, graphing concepts, and strategies for utilizing the book's content in practical situations.
In this video lesson, students will learn about linear programming (LP) and …
In this video lesson, students will learn about linear programming (LP) and will solve an LP problem using the graphical method. Its focus is on the famous "Stigler's diet" problem posed by the 1982 Nobel Laureate in economics, George Stigler. Based on his problem, students will formulate their own diet problem and solve it using the graphical method. The prerequisites to this lesson are basic algebra and geometry. The materials needed for the in-class activities include graphing paper and pencil. This lesson can be completed in one class of approximately one hour. If the teacher would like to cover the simplex algorithm by George Dantzig as an alternative solution method, an additional whole class period is suggested.
No restrictions on your remixing, redistributing, or making derivative works. Give credit to the author, as required.
Your remixing, redistributing, or making derivatives works comes with some restrictions, including how it is shared.
Your redistributing comes with some restrictions. Do not remix or make derivative works.
Most restrictive license type. Prohibits most uses, sharing, and any changes.
Copyrighted materials, available under Fair Use and the TEACH Act for US-based educators, or other custom arrangements. Go to the resource provider to see their individual restrictions.