CK-12 Foundation's Middle School Math Grade 6 Flexbook covers the fundamentals …
CK-12 Foundation's Middle School Math Grade 6 Flexbook covers the fundamentals of fractions, decimals, and geometry. Also explored are units of measurement, graphing concepts, and strategies for utilizing the book's content in practical situations.
This Flash based applet simulates data from a case study of treatments …
This Flash based applet simulates data from a case study of treatments for tumor growth in mice. This simulation allows the user to place mice into a control and treatment groups.
Natural Resources Biometrics begins with a review of descriptive statistics, estimation, and …
Natural Resources Biometrics begins with a review of descriptive statistics, estimation, and hypothesis testing. The following chapters cover one- and two-way analysis of variance (ANOVA), including multiple comparison methods and interaction assessment, with a strong emphasis on application and interpretation. Simple and multiple linear regressions in a natural resource setting are covered in the next chapters, focusing on correlation, model fitting, residual analysis, and confidence and prediction intervals. The final chapters cover growth and yield models, volume and biomass equations, site index curves, competition indices, importance values, and measures of species diversity, association, and community similarity.
Acting as civil engineers hired by the U.S. Department of Transportation to …
Acting as civil engineers hired by the U.S. Department of Transportation to research how to best use piezoelectric materials to detect road damage, student groups are challenged to independently create their own experiment procedures, working with given materials and tools. The general approach is that they set up model roads using rubber mats to simulate asphalt and piezoelectric transducers to simulate the in-ground road sensors. They drop heavy bolts at various locations on the “road,” collecting data and then analyzing the voltage changes across the piezoelectric transducers caused by the vibrations of the bolt hitting the rubber. After making notches in the rubber “road” to simulate cracks and potholes, they collect more data to see if the piezo elements detect the damage. Students write up their research and conclusions as if presenting evidence to USDOT officials about how the voltage changes across the piezo elements can be used to indicate road damage and extrapolated to determine when roads need maintenance service.
CK-12 Advanced Probability and Statistics introduces students to basic topics in statistics …
CK-12 Advanced Probability and Statistics introduces students to basic topics in statistics and probability but finishes with the rigorous topics an advanced placement course requires. Includes visualizations of data, introduction to probability, discrete probability distribution, normal distribution, planning and conducting a study, sampling distributions, hypothesis testing, regression and correlation, Chi-Square, analysis of variance, and non-parametric statistics.
A work in progress, this FlexBook is an introduction to theoretical probability …
A work in progress, this FlexBook is an introduction to theoretical probability and data organization. Students learn about events, conditions, random variables, and graphs and tables that allow them to manage data.
" This course develops logical, empirically based arguments using statistical techniques and …
" This course develops logical, empirically based arguments using statistical techniques and analytic methods. Elementary statistics, probability, and other types of quantitative reasoning useful for description, estimation, comparison, and explanation are covered. Emphasis is on the use and limitations of analytical techniques in planning practice."
This task provides a context to calculate discrete probabilities and represent them …
This task provides a context to calculate discrete probabilities and represent them on a bar graph. It could also be used to create a class activity where students gather, represent, and analyze data, running simulations of the random walk and recording and then displaying their results.
This course covers the fundamentals of mathematical analysis: convergence of sequences and …
This course covers the fundamentals of mathematical analysis: convergence of sequences and series, continuity, differentiability, Riemann integral, sequences and series of functions, uniformity, and the interchange of limit operations. It shows the utility of abstract concepts and teaches an understanding and construction of proofs. MIT students may choose to take one of three versions of Real Analysis; this version offers three additional units of credit for instruction and practice in written and oral presentation.The three options for 18.100:Option A (18.100A) chooses less abstract definitions and proofs, and gives applications where possible.Option B (18.100B) is more demanding and for students with more mathematical maturity; it places more emphasis from the beginning on point-set topology and n-space, whereas Option A is concerned primarily with analysis on the real line, saving for the last weeks work in 2-space (the plane) and its point-set topology.Option C (18.100C) is a 15-unit variant of Option B, with further instruction and practice in written and oral communication. This fulfills the MIT CI requirement.
The purpose of this task is to have students complete normal distribution …
The purpose of this task is to have students complete normal distribution calculations and to use properties of normal distributions to draw conclusions. The task is designed to encourage students to communicate their findings in a narrative/report form in context Đ not just simply as a computed number.
The purpose of this task is to allow students to demonstrate an …
The purpose of this task is to allow students to demonstrate an ability to construct boxplots and to use boxplots as the basis for comparing distributions. The solution should directly compare the center, spread, and shape of the two distributions and comment on the high outlier in the northbound data set.
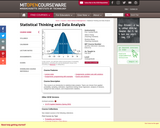
This course is an introduction to statistical data analysis. Topics are chosen …
This course is an introduction to statistical data analysis. Topics are chosen from applied probability, sampling, estimation, hypothesis testing, linear regression, analysis of variance, categorical data analysis, and nonparametric statistics.
Students are introduced to Hooke's law as well as stress-strain relationships. First …
Students are introduced to Hooke's law as well as stress-strain relationships. First they learn the governing equations, then they work through several example problems, first individually, then as a class. Through the lesson's two-part associated activity, students 1) explore Hooke's law by experimentally determining an unknown spring constant, and then 2) apply what they've learned to create a strain graph depicting a tumor using Microsoft Excel®. After the activities, the lesson concludes with a stress-strain quiz to assess each student's comprehension of the concepts.
No restrictions on your remixing, redistributing, or making derivative works. Give credit to the author, as required.
Your remixing, redistributing, or making derivatives works comes with some restrictions, including how it is shared.
Your redistributing comes with some restrictions. Do not remix or make derivative works.
Most restrictive license type. Prohibits most uses, sharing, and any changes.
Copyrighted materials, available under Fair Use and the TEACH Act for US-based educators, or other custom arrangements. Go to the resource provider to see their individual restrictions.