: Fundamental mathematics for adult learners. Book 5 includes a Table of …
: Fundamental mathematics for adult learners. Book 5 includes a Table of Contents, Glossary, Grades Records, Self Tests, Practice Tests and Unit Tests. Ancillary Resources include the Instructor's Manual. This is 1 of a series of 6 books in the ABE Math collection.
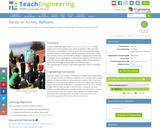
Students follow the steps of the engineering design process as they design …
Students follow the steps of the engineering design process as they design and construct balloons for aerial surveillance. After their first attempts to create balloons, they are given the associated Estimating Buoyancy lesson to learn about volume, buoyancy and density to help them iterate more successful balloon designs.Applying their newfound knowledge, the young engineers build and test balloons that fly carrying small flip cameras that capture aerial images of their school. Students use the aerial footage to draw maps and estimate areas.
This is course material published for a secondary Math 1 course. Authors of …
This is course material published for a secondary Math 1 course. Authors of this work are: Scott Hendrickson, Joleigh Honey, Barbara Kuehl, Travis Lemon, Janet Sutorius and updated from the original work in 2013 in partnership with the Utah State Office of Education.
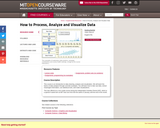
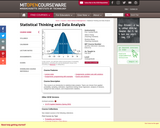
This course is an introduction to data cleaning, analysis and visualization. We …
This course is an introduction to data cleaning, analysis and visualization. We will teach the basics of data analysis through concrete examples. You will learn how to take raw data, extract meaningful information, use statistical tools, and make visualizations. This was offered as a non-credit course during the Independent Activities Period (IAP), which is a special 4-week term at MIT that runs from the first week of January until the end of the month.
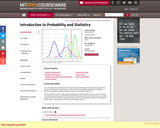
Elementary introduction with applications. Basic probability models. Combinatorics. Random variables. Discrete and …
Elementary introduction with applications. Basic probability models. Combinatorics. Random variables. Discrete and continuous probability distributions. Statistical estimation and testing. Confidence intervals. Introduction to linear regression.
" This course will provide a solid foundation in probability and statistics …
" This course will provide a solid foundation in probability and statistics for economists and other social scientists. We will emphasize topics needed for further study of econometrics and provide basic preparation for 14.32. Topics include elements of probability theory, sampling theory, statistical estimation, and hypothesis testing."
The book "Introductory Business Statistics" by Thomas K. Tiemann explores the basic …
The book "Introductory Business Statistics" by Thomas K. Tiemann explores the basic ideas behind statistics, such as populations, samples, the difference between data and information, and most importantly sampling distributions. The author covers topics including descriptive statistics and frequency distributions, normal and t-distributions, hypothesis testing, t-tests, f-tests, analysis of variance, non-parametric tests, and regression basics. Using real-world examples throughout the text, the author hopes to help students understand how statistics works, not just how to "get the right number."
This Flash based applet simulates data from a case study of treatments …
This Flash based applet simulates data from a case study of treatments for tumor growth in mice. This simulation allows the user to place mice into a control and treatment groups.
CK-12 Advanced Probability and Statistics introduces students to basic topics in statistics …
CK-12 Advanced Probability and Statistics introduces students to basic topics in statistics and probability but finishes with the rigorous topics an advanced placement course requires. Includes visualizations of data, introduction to probability, discrete probability distribution, normal distribution, planning and conducting a study, sampling distributions, hypothesis testing, regression and correlation, Chi-Square, analysis of variance, and non-parametric statistics.
A work in progress, this FlexBook is an introduction to theoretical probability …
A work in progress, this FlexBook is an introduction to theoretical probability and data organization. Students learn about events, conditions, random variables, and graphs and tables that allow them to manage data.
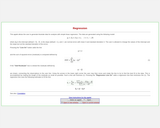
This applet from Statistical Java allows the user to generate bivariate data …
This applet from Statistical Java allows the user to generate bivariate data for analysis with simple linear regression. The page describes the equations used to generate the data and estimate the regression lines.
This is a task from the Illustrative Mathematics website that is one …
This is a task from the Illustrative Mathematics website that is one part of a complete illustration of the standard to which it is aligned. Each task has at least one solution and some commentary that addresses important aspects of the task and its potential use.
Dawson (1995) presented a data set giving a population at risk and …
Dawson (1995) presented a data set giving a population at risk and fatalities for an “unusual episode” (the sinking of the ocean liner Titanic) and discussed the use of the data set in a first statistics course as an elementary exercise in statistical thinking, the goal being to deduce the origin of the data. Simonoff (1997) discussed the use of this data set in a second statistics course to illustrate logistic regression. Moore (2000) used an abbreviated form of the data set in a chapter exercise on the chi-square test. This article describes an activity that illustrates contingency table (two-way table) analysis. Students use contingency tables to analyze the “unusual episode” data (from Dawson 1995) and attempt to use their analysis to deduce the origin of the data. The activity is appropriate for use in an introductory college statistics course or in a high school AP statistics course.
As teachers of statistics, we know that residual plots and other diagnostics …
As teachers of statistics, we know that residual plots and other diagnostics are important to deciding whether or not linear regression is appropriate for a set of data. Despite talking with our students about this, many students might believe that if the correlation coefficient is strong enough, these diagnostic checks are not important. The data set included in this activity was created to lure students into a situation that looks on the surface to be appropriate for the use of linear regression but is instead based (loosely) on a quadratic function.
This activity is an advanced version of the “Keep your eyes on …
This activity is an advanced version of the “Keep your eyes on the ball” activity by Bereska, et al. (1999). Students should gain experience with differentiating between independent and dependent variables, using linear regression to describe the relationship between these variables, and drawing inference about the parameters of the population regression line. Each group of students collects data on the rebound heights of a ball dropped multiple times from each of several different heights. By plotting the data, students quickly recognize the linear relationship. After obtaining the least squares estimate of the population regression line, students can set confidence intervals or test hypotheses on the parameters. Predictions of rebound length can be made for new values of the drop height as well. Data from different groups can be used to test for equality of the intercepts and slopes. By focusing on a particular drop height and multiple types of balls, one can also introduce the concept of analysis of variance.
This course is an introduction to statistical data analysis. Topics are chosen …
This course is an introduction to statistical data analysis. Topics are chosen from applied probability, sampling, estimation, hypothesis testing, linear regression, analysis of variance, categorical data analysis, and nonparametric statistics.
This course is a broad treatment of statistics, concentrating on specific statistical …
This course is a broad treatment of statistics, concentrating on specific statistical techniques used in science and industry. Topics include: hypothesis testing and estimation, confidence intervals, chi-square tests, nonparametric statistics, analysis of variance, regression, correlation, decision theory, and Bayesian statistics.
No restrictions on your remixing, redistributing, or making derivative works. Give credit to the author, as required.
Your remixing, redistributing, or making derivatives works comes with some restrictions, including how it is shared.
Your redistributing comes with some restrictions. Do not remix or make derivative works.
Most restrictive license type. Prohibits most uses, sharing, and any changes.
Copyrighted materials, available under Fair Use and the TEACH Act for US-based educators, or other custom arrangements. Go to the resource provider to see their individual restrictions.