: Fundamental mathematics for adult learners. Book 5 includes a Table of …
: Fundamental mathematics for adult learners. Book 5 includes a Table of Contents, Glossary, Grades Records, Self Tests, Practice Tests and Unit Tests. Ancillary Resources include the Instructor's Manual. This is 1 of a series of 6 books in the ABE Math collection.
In this course, we study elliptic Partial Differential Equations (PDEs) with variable …
In this course, we study elliptic Partial Differential Equations (PDEs) with variable coefficients building up to the minimal surface equation. Then we study Fourier and harmonic analysis, emphasizing applications of Fourier analysis. We will see some applications in combinatorics / number theory, like the Gauss circle problem, but mostly focus on applications in PDE, like the Calderon-Zygmund inequality for the Laplacian, and the Strichartz inequality for the Schrodinger equation. In the last part of the course, we study solutions to the linear and the non-linear Schrodinger equation. All through the course, we work on the craft of proving estimates.
This is course material published for a secondary Math 1 course. Authors of …
This is course material published for a secondary Math 1 course. Authors of this work are: Scott Hendrickson, Joleigh Honey, Barbara Kuehl, Travis Lemon, Janet Sutorius and updated from the original work in 2013 in partnership with the Utah State Office of Education.
This course is an introduction to data cleaning, analysis and visualization. We …
This course is an introduction to data cleaning, analysis and visualization. We will teach the basics of data analysis through concrete examples. You will learn how to take raw data, extract meaningful information, use statistical tools, and make visualizations. This was offered as a non-credit course during the Independent Activities Period (IAP), which is a special 4-week term at MIT that runs from the first week of January until the end of the month.
Elementary introduction with applications. Basic probability models. Combinatorics. Random variables. Discrete and …
Elementary introduction with applications. Basic probability models. Combinatorics. Random variables. Discrete and continuous probability distributions. Statistical estimation and testing. Confidence intervals. Introduction to linear regression.
" This course will provide a solid foundation in probability and statistics …
" This course will provide a solid foundation in probability and statistics for economists and other social scientists. We will emphasize topics needed for further study of econometrics and provide basic preparation for 14.32. Topics include elements of probability theory, sampling theory, statistical estimation, and hypothesis testing."
The book "Introductory Business Statistics" by Thomas K. Tiemann explores the basic …
The book "Introductory Business Statistics" by Thomas K. Tiemann explores the basic ideas behind statistics, such as populations, samples, the difference between data and information, and most importantly sampling distributions. The author covers topics including descriptive statistics and frequency distributions, normal and t-distributions, hypothesis testing, t-tests, f-tests, analysis of variance, non-parametric tests, and regression basics. Using real-world examples throughout the text, the author hopes to help students understand how statistics works, not just how to "get the right number."
The learning of linear functions is pervasive in most algebra classrooms. Linear …
The learning of linear functions is pervasive in most algebra classrooms. Linear functions are vital in laying the foundation for understanding the concept of modeling. This unit gives students the opportunity to make use of linear models in order to make predictions based on real-world data, and see how engineers address incredible and important design challenges through the use of linear modeling. Student groups act as engineering teams by conducting experiments to collect data and model the relationship between the wall thickness of the latex tubes and their corresponding strength under pressure (to the point of explosion). Students learn to graph variables with linear relationships and use collected data from their designed experiment to make important decisions regarding the feasibility of hydraulic systems in hybrid vehicles and the necessary tube size to make it viable.
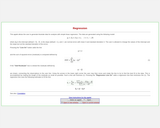
Students complete an exercise showing logarithmic relationships and examine how to find …
Students complete an exercise showing logarithmic relationships and examine how to find the linear regression of data that does not seem linear upon initial examination. They relate number of BMD scanners to time.
This Flash based applet simulates data from a case study of treatments …
This Flash based applet simulates data from a case study of treatments for tumor growth in mice. This simulation allows the user to place mice into a control and treatment groups.
CK-12 Advanced Probability and Statistics introduces students to basic topics in statistics …
CK-12 Advanced Probability and Statistics introduces students to basic topics in statistics and probability but finishes with the rigorous topics an advanced placement course requires. Includes visualizations of data, introduction to probability, discrete probability distribution, normal distribution, planning and conducting a study, sampling distributions, hypothesis testing, regression and correlation, Chi-Square, analysis of variance, and non-parametric statistics.
A work in progress, this FlexBook is an introduction to theoretical probability …
A work in progress, this FlexBook is an introduction to theoretical probability and data organization. Students learn about events, conditions, random variables, and graphs and tables that allow them to manage data.
This course covers the fundamentals of mathematical analysis: convergence of sequences and …
This course covers the fundamentals of mathematical analysis: convergence of sequences and series, continuity, differentiability, Riemann integral, sequences and series of functions, uniformity, and the interchange of limit operations. It shows the utility of abstract concepts and teaches an understanding and construction of proofs. MIT students may choose to take one of three versions of Real Analysis; this version offers three additional units of credit for instruction and practice in written and oral presentation.The three options for 18.100:Option A (18.100A) chooses less abstract definitions and proofs, and gives applications where possible.Option B (18.100B) is more demanding and for students with more mathematical maturity; it places more emphasis from the beginning on point-set topology and n-space, whereas Option A is concerned primarily with analysis on the real line, saving for the last weeks work in 2-space (the plane) and its point-set topology.Option C (18.100C) is a 15-unit variant of Option B, with further instruction and practice in written and oral communication. This fulfills the MIT CI requirement.
This applet from Statistical Java allows the user to generate bivariate data …
This applet from Statistical Java allows the user to generate bivariate data for analysis with simple linear regression. The page describes the equations used to generate the data and estimate the regression lines.
This activity is an advanced version of the “Keep your eyes on …
This activity is an advanced version of the “Keep your eyes on the ball” activity by Bereska, et al. (1999). Students should gain experience with differentiating between independent and dependent variables, using linear regression to describe the relationship between these variables, and drawing inference about the parameters of the population regression line. Each group of students collects data on the rebound heights of a ball dropped multiple times from each of several different heights. By plotting the data, students quickly recognize the linear relationship. After obtaining the least squares estimate of the population regression line, students can set confidence intervals or test hypotheses on the parameters. Predictions of rebound length can be made for new values of the drop height as well. Data from different groups can be used to test for equality of the intercepts and slopes. By focusing on a particular drop height and multiple types of balls, one can also introduce the concept of analysis of variance.
This course is an introduction to statistical data analysis. Topics are chosen …
This course is an introduction to statistical data analysis. Topics are chosen from applied probability, sampling, estimation, hypothesis testing, linear regression, analysis of variance, categorical data analysis, and nonparametric statistics.
This course is a broad treatment of statistics, concentrating on specific statistical …
This course is a broad treatment of statistics, concentrating on specific statistical techniques used in science and industry. Topics include: hypothesis testing and estimation, confidence intervals, chi-square tests, nonparametric statistics, analysis of variance, regression, correlation, decision theory, and Bayesian statistics.
No restrictions on your remixing, redistributing, or making derivative works. Give credit to the author, as required.
Your remixing, redistributing, or making derivatives works comes with some restrictions, including how it is shared.
Your redistributing comes with some restrictions. Do not remix or make derivative works.
Most restrictive license type. Prohibits most uses, sharing, and any changes.
Copyrighted materials, available under Fair Use and the TEACH Act for US-based educators, or other custom arrangements. Go to the resource provider to see their individual restrictions.