Students will explore distributions of various census data sets to determine whether …
Students will explore distributions of various census data sets to determine whether it can be reasonably assumed that those data follow a normal distribution, based on students’ analysis of either a histogram or a normal probability plot for each data set. They will then discuss their findings with a partner who analyzed the other type of graph for each data set.
Students will use census data from a sample of 136 U.S. counties …
Students will use census data from a sample of 136 U.S. counties and other sample data to make estimates about the U.S. population that is 65 or older in all other counties and about other variables, using normal distribution models.
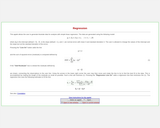
This applet from Statistical Java allows the user to generate bivariate data …
This applet from Statistical Java allows the user to generate bivariate data for analysis with simple linear regression. The page describes the equations used to generate the data and estimate the regression lines.
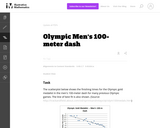
This is a task from the Illustrative Mathematics website that is one …
This is a task from the Illustrative Mathematics website that is one part of a complete illustration of the standard to which it is aligned. Each task has at least one solution and some commentary that addresses important asects of the task and its potential use. Here are the first few lines of the commentary for this task: The scatterplot below shows the finishing times for the Olympic gold medalist in the men's 100-meter dash for many previous Olympic games. The least sq...
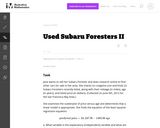
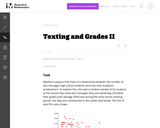
This is a task from the Illustrative Mathematics website that is one …
This is a task from the Illustrative Mathematics website that is one part of a complete illustration of the standard to which it is aligned. Each task has at least one solution and some commentary that addresses important asects of the task and its potential use. Here are the first few lines of the commentary for this task: Jane wants to sell her Subaru Forester and does research online to find other cars for sale in her area. She checks on craigslist.com and finds 22 Suba...
This web-based graphing activity explores the similarities and differences between Velocity vs. …
This web-based graphing activity explores the similarities and differences between Velocity vs. Time and Position vs. Time graphs. It interactively accepts user inputs in creating "prediction graphs", then provides real-time animations of the process being analyzed. Learners will annotate graphs to explain changes in motion, respond to question sets, and analyze why the two types of graphs appear as they do. It is appropriate for secondary physical science courses, and may also be used for remediation in preparatory high school physics courses. This item is part of the Concord Consortium, a nonprofit research and development organization dedicated to transforming education through technology. Users must register to access full functionality of all the tools available with SmartGraphs.
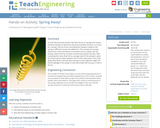
This lab demonstrates Hooke's Law with the use of springs and masses. …
This lab demonstrates Hooke's Law with the use of springs and masses. Students attempt to determine the proportionality constant, or k-value, for a spring. They do this by calculating the change in length of the spring as different masses are added to it. The concept of a spring's elastic limit is also introduced, and the students test to makes sure the spring's elastic limit has not been reached during their lab tests. After compiling their data, they attempt to find an average value of the spring's k-value by measuring the slopes between each of their data points. Then they apply what they've learned about springs to how engineers might use that knowledge in the design of a toy that enables kids to jump 2-3 feet in the air.
This course is an introduction to statistical data analysis. Topics are chosen …
This course is an introduction to statistical data analysis. Topics are chosen from applied probability, sampling, estimation, hypothesis testing, linear regression, analysis of variance, categorical data analysis, and nonparametric statistics.
This course is a broad treatment of statistics, concentrating on specific statistical …
This course is a broad treatment of statistics, concentrating on specific statistical techniques used in science and industry. Topics include: hypothesis testing and estimation, confidence intervals, chi-square tests, nonparametric statistics, analysis of variance, regression, correlation, decision theory, and Bayesian statistics.
Students will explore an interactive data visualization of state-by-state population growth as …
Students will explore an interactive data visualization of state-by-state population growth as measured by the decennial censuses of 1790 through 2010. Students will also analyze and make inferences about the causes of more recent shifts in U.S. population.
Students will examine questions from 1940, 1960, and 2010 census questionnaires to …
Students will examine questions from 1940, 1960, and 2010 census questionnaires to analyze socioeconomic changes in the U.S. population before and after World War II.
No restrictions on your remixing, redistributing, or making derivative works. Give credit to the author, as required.
Your remixing, redistributing, or making derivatives works comes with some restrictions, including how it is shared.
Your redistributing comes with some restrictions. Do not remix or make derivative works.
Most restrictive license type. Prohibits most uses, sharing, and any changes.
Copyrighted materials, available under Fair Use and the TEACH Act for US-based educators, or other custom arrangements. Go to the resource provider to see their individual restrictions.