Updating search results...

Search Resources

244 Results

View
Selected filters:
  • Measurement and Data
Converting Capacities Using Pictures English Units
Conditional Remix & Share Permitted
CC BY-NC-SA
Rating
0.0 stars

This short video and interactive assessment activity is designed to teach fifth graders about converting gallons to quarts.

Subject:
Mathematics
Measurement and Data
Material Type:
Assessment
Interactive
Lecture
Provider:
CK-12 Foundation
Provider Set:
CK-12 Elementary Math
Date Added:
04/03/2018
Converting Centimeters to Millimeters
Conditional Remix & Share Permitted
CC BY-NC-SA
Rating
0.0 stars

This short video and interactive assessment activity is designed to teach fifth graders about converting centimeters to millimeters.

Subject:
Mathematics
Measurement and Data
Material Type:
Assessment
Interactive
Lecture
Provider:
CK-12 Foundation
Provider Set:
CK-12 Elementary Math
Date Added:
04/03/2018
Converting Fractions of a Unit into a Smaller Unit
Unrestricted Use
CC BY
Rating
0.0 stars

This task gives students word problems with a given a set of a specified size and a specified number of subsets. The questions ask the student to find out the size of each of the subsets.

Subject:
Mathematics
Measurement and Data
Numbers and Operations
Material Type:
Activity/Lab
Provider:
Illustrative Mathematics
Provider Set:
Illustrative Mathematics
Author:
Illustrative Mathematics
Date Added:
05/01/2012
Converting Gallons Quarts Pints and Cups with Pictures English Units
Conditional Remix & Share Permitted
CC BY-NC-SA
Rating
0.0 stars

This short video and interactive assessment activity is designed to give fifth graders an overview of comparison of capacity (gallons, pints, and quarts).

Subject:
Mathematics
Measurement and Data
Material Type:
Assessment
Interactive
Lecture
Provider:
CK-12 Foundation
Provider Set:
CK-12 Elementary Math
Date Added:
04/03/2018
Converting Gallons and Quarts Into Cups
Conditional Remix & Share Permitted
CC BY-NC-SA
Rating
0.0 stars

This short video and interactive assessment activity is designed to teach fifth graders about converting gallons and quarts into cups.

Subject:
Mathematics
Measurement and Data
Material Type:
Assessment
Interactive
Lecture
Provider:
CK-12 Foundation
Provider Set:
CK-12 Elementary Math
Date Added:
04/03/2018
Converting Kilograms and Grams Into Grams
Conditional Remix & Share Permitted
CC BY-NC-SA
Rating
0.0 stars

This short video and interactive assessment activity is designed to teach fifth graders about converting kilograms and grams into grams.

Subject:
Mathematics
Measurement and Data
Material Type:
Assessment
Interactive
Lecture
Provider:
CK-12 Foundation
Provider Set:
CK-12 Elementary Math
Date Added:
04/03/2018
Data Gems by the US Census Bureau
Unrestricted Use
Public Domain
Rating
0.0 stars

Our team of experts is excited to share with you their favorite tips and tricks about how to access and use Census Bureau Data.

So we created the Data Gems: a series of "how-to" videos available for data users who are looking for an easy and quick way to enhance their knowledge of Census data.

They will introduce you to various concepts and techniques to improve your ability to navigate our website and use our data-access tools.

We hope you find these Gems valuable! Drop us a line at census.academy@census.gov and let us know what you think!

Subject:
Business and Communication
Career and Technical Education
Cultural Geography
Economics
Education
Educational Technology
Environmental Studies
History
Marketing
Mathematics
Measurement and Data
Physical Geography
Physical Science
Ratios and Proportions
Social Science
Statistics and Probability
U.S. History
Material Type:
Activity/Lab
Data Set
Author:
Us Census Bureau
Date Added:
09/01/2021
Describing Distributions on Histograms
Unrestricted Use
CC BY
Rating
0.0 stars

Unit 8: Data Sets and Distributions
Lesson 8: Describing Distributions on Histograms

In this lesson, students explore various shapes and features of a distribution displayed in a histogram. They use the structure (MP7) to look for symmetry, peaks, clusters, gaps, and any unusual values in histograms. Students also begin to consider how these features might affect how we characterize a data set. For example, how might we describe what is typical in a distribution that shows symmetry? What about in a distribution that has one peak that is not symmetrical? This work is informal, but helps to prepare students to better understand measures of center and spread later in the unit. Students also distinguish between the uses and construction of bar graphs and histograms in this lesson.

Subject:
Mathematics
Measurement and Data
Material Type:
Activity/Lab
Date Added:
06/16/2021
Designing a Tent
Unrestricted Use
CC BY
Rating
0.0 stars

Unit: Area and Surface Area
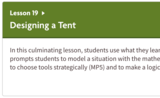
Lesson 19: Designing a Tent

In this culminating lesson, students use what they learned in this unit to design a tent and determine how much fabric is needed for the tent. The task prompts students to model a situation with the mathematics they know, make assumptions, and plan a path to solve a problem (MP4). It also allows students to choose tools strategically (MP5) and to make a logical argument to support their reasoning (MP3).

The lesson has two parts. In the first part, students learn about the task, gather information, and begin designing. The introduction is important to ensure all students understand the context. Then, after answering some preparatory questions in groups and as a class, students work individually to design and draw their tents. They use their knowledge of area and surface area to calculate and justify an estimate of the amount of fabric needed for their design.

The second part involves reflection and discussion of students’ work. Students explain their work to a partner or small group, discuss and compare their designs, and consider the impact of design decisions on the surface areas of their tents.

Depending on instructional choices made, this lesson could take one or more class meetings. The time estimates are intentionally left blank, as the time needed will vary based on instructional decisions made. It may depend on:

whether students use the provided information about tents and sleeping bags or research this information.
whether the Tent Design Planning Sheet is provided or students organize their work with more autonomy.
expectations around drafting, revising, and the final product.
how student work is ultimately shared with the class (not at all, informally, or with formal presentations).
Note: Students will need to bring in a personal collection of 10–50 small objects ahead of time for the first lesson of the next unit. Examples include rocks, seashells, trading cards, or coins.

Subject:
Geometry
Mathematics
Measurement and Data
Material Type:
Activity/Lab
Date Added:
04/07/2021
Determine Distance Using Addition
Conditional Remix & Share Permitted
CC BY-NC-SA
Rating
0.0 stars

This short video and interactive assessment activity is designed to teach second graders about using real maps (english lengths and distances).

Subject:
Mathematics
Measurement and Data
Material Type:
Assessment
Interactive
Lecture
Provider:
CK-12 Foundation
Provider Set:
CK-12 Elementary Math
Date Added:
04/03/2018
Determining the Amount Needed to Fill a Container English Units
Conditional Remix & Share Permitted
CC BY-NC-SA
Rating
0.0 stars

This short video and interactive assessment activity is designed to give fifth graders an overview of capacity - word problems.

Subject:
Mathematics
Measurement and Data
Material Type:
Assessment
Interactive
Lecture
Provider:
CK-12 Foundation
Provider Set:
CK-12 Elementary Math
Date Added:
04/03/2018
Deviation from the Mean
Unrestricted Use
CC BY
Rating
0.0 stars

Unit 8: Data Sets and Distributions
Lesson 11: Deviation from the Mean

In a previous lesson, students computed and interpreted distances of data points from the mean. In this lesson, they take that experience to make sense of the formal idea of mean absolute deviation (MAD). Students learn that the MAD is the average distance of data points from the mean. They use their knowledge of how to calculate and interpret the mean to calculate (MP8) and interpret (MP2) the MAD.

Students also learn that we think of the MAD as a measure of variability or a measure of spread of a distribution. They compare distributions with the same mean but different MADs, and recognize that the centers are the same but the distribution with the larger MAD has greater variability or spread.

Subject:
Mathematics
Measurement and Data
Material Type:
Activity/Lab
Date Added:
06/16/2021
Discovering Relationships between Side Length and Area
Rating
0.0 stars

Through this lesson and its two associated activities, students are introduced to the use of geometry in engineering design, and conclude by making scale models of objects of their choice. The practice of developing scale models is often used in engineering design to analyze the effectiveness of proposed design solutions. In this lesson, students complete fencing (square) and fire pit (circle) word problems on two worksheets—which involves side and radius dimensions, perimeters, circumferences and areas—guiding them to discover the relationships between the side length of a square and its area, and the radius of a circle and its area. They also think of real-world engineering applications of the geometry concepts.

Subject:
Geometry
Mathematics
Measurement and Data
Material Type:
Lesson
Author:
Maia Vadeen
Malinda Zarske
Nathan Coyle
Russell Anderson
Ryan Sullivan
Aaron Lamplugh
Date Added:
08/11/2020
Distances Between Points On Multiple Routes Metric Units
Conditional Remix & Share Permitted
CC BY-NC-SA
Rating
0.0 stars

This short video and interactive assessment activity is designed to teach fifth graders about distances between points on multiple routes (metric units).

Subject:
Mathematics
Measurement and Data
Material Type:
Assessment
Interactive
Lecture
Provider:
CK-12 Foundation
Provider Set:
CK-12 Elementary Math
Date Added:
04/03/2018