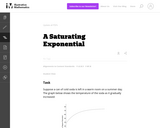
The context of this task is a familiar one: a cold beverage …
The context of this task is a familiar one: a cold beverage warms once it is taken out of the refrigerator. Rather than giving the explicit function governing this warmth, a graph is presented along with the general form of the function. Students must then interpret the graph in order to understand more specific details regarding the function.
This learning video presents an introduction to graph theory through two fun, …
This learning video presents an introduction to graph theory through two fun, puzzle-like problems: ''The Seven Bridges of Konigsberg'' and ''The Chinese Postman Problem''. Any high school student in a college-preparatory math class should be able to participate in this lesson. Materials needed include: pen and paper for the students; if possible, printed-out copies of the graphs and image that are used in the module; and a blackboard or equivalent. During this video lesson, students will learn graph theory by finding a route through a city/town/village without crossing the same path twice. They will also learn to determine the length of the shortest route that covers all the roads in a city/town/village. To achieve these two learning objectives, they will use nodes and arcs to create a graph and represent a real problem.
Three Weeks in March is a data-driven approach to modeling the spread of …
Three Weeks in March is a data-driven approach to modeling the spread of coronavirus cases in the United States.In this activity, students will use a difference equation to model day-to-day changes in the known cases of coronavirus within U.S. borders, as reported by the Centers for Disease Control and Prevention, during the first three weeks of March, 2020. The solution to this difference equation is an exponential model. The activity can serve as an introduction to exponential models.The main goals of this activity are to:Learn the idea of difference equation;Model exponential growth using a difference equation;Simulate exponential growth and estimate a parameter value using software.These resources were created by Dr. Rob Kipka of Lake Superior State University.
This task focuses on the fact that linear functions are characterized by …
This task focuses on the fact that linear functions are characterized by constant differences over equal intervals. It could be used alongside to F-LE Equal Differences over Equal Intervals I & II.
Students learn how to quickly and efficiently interpret graphs, which are used …
Students learn how to quickly and efficiently interpret graphs, which are used for everyday purposes as well as engineering analysis. Through a practice handout completed as a class and a worksheet completed in small groups, students gain familiarity in talking about and interpreting graphs. They use common graph terminology such as independent variable, dependent variable, linear data, linear relationship and rate of change. The equation for calculating slope is explained. The focus is on students becoming able to clearly describe linear relationships by using the language of slope and the rate of change between variables. At lesson end, students discuss the relationship between variables as presented by the visual representation of a graph. Then they independently complete a homework handout.
Investigate the effect of gravity on objects of various mass during free …
Investigate the effect of gravity on objects of various mass during free fall. Predict what the position-time and velocity-time graphs will look like. Compare graphs for light and heavy objects. Was Galileo Right is the last of five SmartGraphs activities designed for a typical physical science unit of study on the motion of objects.
No restrictions on your remixing, redistributing, or making derivative works. Give credit to the author, as required.
Your remixing, redistributing, or making derivatives works comes with some restrictions, including how it is shared.
Your redistributing comes with some restrictions. Do not remix or make derivative works.
Most restrictive license type. Prohibits most uses, sharing, and any changes.
Copyrighted materials, available under Fair Use and the TEACH Act for US-based educators, or other custom arrangements. Go to the resource provider to see their individual restrictions.