This task examines, from a mathematical and statistical point of view, how …
This task examines, from a mathematical and statistical point of view, how scientists measure the age of organic materials by measuring the ratio of Carbon 14 to Carbon 12. The focus here is on the statistical nature of such dating. This task addresses a very important issue about precision in reporting and understanding statements in a realistic scientific context.
: Fundamental mathematics for adult learners. Book 5 includes a Table of …
: Fundamental mathematics for adult learners. Book 5 includes a Table of Contents, Glossary, Grades Records, Self Tests, Practice Tests and Unit Tests. Ancillary Resources include the Instructor's Manual. This is 1 of a series of 6 books in the ABE Math collection.
CK-12 Foundation's Basic Algebra FlexBook is an introduction to the algebraic topics …
CK-12 Foundation's Basic Algebra FlexBook is an introduction to the algebraic topics of functions, equations, and graphs for middle-school and high-school students.
Students will examine a table of 1850 Census data on employment to …
Students will examine a table of 1850 Census data on employment to understand the professions of free men across the United States at the time, calculating the percentages working in different industries. Students will also compare and contrast economies in the North and South during the Antebellum Period.
This task was developed by high school and postsecondary mathematics and health …
This task was developed by high school and postsecondary mathematics and health sciences educators, and validated by content experts in the Common Core State Standards in mathematics and the National Career Clusters Knowledge & Skills Statements. It was developed with the purpose of demonstrating how the Common Core and CTE Knowledge & Skills Statements can be integrated into classroom learning - and to provide classroom teachers with a truly authentic task for either mathematics or CTE courses.
Students will calculate various measures of central tendency using data on the …
Students will calculate various measures of central tendency using data on the number of people who bike to work in select states. Students will then create a box plot to represent the data set and answer conceptual questions about the impact of the data set’s outlier.
Students will learn about the nature and importance of qualitative research as …
Students will learn about the nature and importance of qualitative research as a complement to numerical data — specifically how sociologists use in-depth ethnographic research to study specific places and groups. After students investigate census data on the demographics of their school’s ZIP code, they will observe a location at their school (e.g., a student center or cafeteria). Students will record their notes, understanding the importance of reflexivity in field research. Then they will write a short paper about their field study.
The applet in this section allows for simple data analysis of univariate …
The applet in this section allows for simple data analysis of univariate data. Users can either generate normal or uniform data for k samples or copy and paste data from another source to a text box. A univariate analysis is performed for all k samples.
This task requires students to use the normal distribution as a model …
This task requires students to use the normal distribution as a model for a data distribution. Students must use given means and standard deviations to approximate population percentages. There are several ways (tables, graphing calculators, or statistical software) that students might calculate the required normal percentages. Depending on the method used, answers might vary somewhat from those shown in the solution.
Students will examine maps to explore changes in population density in the …
Students will examine maps to explore changes in population density in the United States during three decades: 1920–1930 (Post-Progressive Era), 1930–1940 (Great Depression), and 1940–1950 (World War II). They will then determine what happened during each decade that likely influenced geographic mobility. Students will also examine a map of more recent population data (for 2000–2010) to understand trends in population movement.
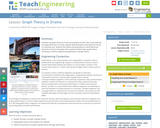
Students use graph theory to create social graphs for their own social …
Students use graph theory to create social graphs for their own social networks and apply what learn to create a graph representing the social dynamics found in a dramatic text. Students then derive meaning based on what they know about the text from the graphs they created. Students learn graph theory vocabulary, as well as engineering applications of graph theory.
This problem could be used as an introductory lesson to introduce group …
This problem could be used as an introductory lesson to introduce group comparisons and to engage students in a question they may find amusing and interesting. More generally, the idea of the lesson could be used as a template for a project where students develop a questionnaire, sample students at their school and report on their findings.
This is course material published for a secondary Math 1 course. Authors of …
This is course material published for a secondary Math 1 course. Authors of this work are: Scott Hendrickson, Joleigh Honey, Barbara Kuehl, Travis Lemon, Janet Sutorius and updated from the original work in 2013 in partnership with the Utah State Office of Education.
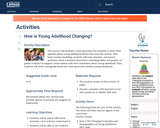
The teacher will facilitate a class discussion for students to share their …
The teacher will facilitate a class discussion for students to share their opinions about young adulthood before they start the activity. After some teacher modeling, students will read, annotate, and answer questions about a technical document—including tables and graphs—to gather evidence to support conversations with their classmates about young adulthood. Then, students will write a paragraph about how their generation defines young adulthood.
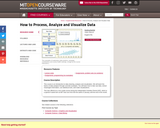
This course is an introduction to data cleaning, analysis and visualization. We …
This course is an introduction to data cleaning, analysis and visualization. We will teach the basics of data analysis through concrete examples. You will learn how to take raw data, extract meaningful information, use statistical tools, and make visualizations. This was offered as a non-credit course during the Independent Activities Period (IAP), which is a special 4-week term at MIT that runs from the first week of January until the end of the month.
Elementary introduction with applications. Basic probability models. Combinatorics. Random variables. Discrete and …
Elementary introduction with applications. Basic probability models. Combinatorics. Random variables. Discrete and continuous probability distributions. Statistical estimation and testing. Confidence intervals. Introduction to linear regression.
" This course will provide a solid foundation in probability and statistics …
" This course will provide a solid foundation in probability and statistics for economists and other social scientists. We will emphasize topics needed for further study of econometrics and provide basic preparation for 14.32. Topics include elements of probability theory, sampling theory, statistical estimation, and hypothesis testing."
The book "Introductory Business Statistics" by Thomas K. Tiemann explores the basic …
The book "Introductory Business Statistics" by Thomas K. Tiemann explores the basic ideas behind statistics, such as populations, samples, the difference between data and information, and most importantly sampling distributions. The author covers topics including descriptive statistics and frequency distributions, normal and t-distributions, hypothesis testing, t-tests, f-tests, analysis of variance, non-parametric tests, and regression basics. Using real-world examples throughout the text, the author hopes to help students understand how statistics works, not just how to "get the right number."
Students experience data collection, analysis and inquiry in this LEGO® MINDSTORMS® NXT …
Students experience data collection, analysis and inquiry in this LEGO® MINDSTORMS® NXT -based activity. They measure the position of an oscillating platform using a ultrasonic sensor and perform statistical analysis to determine the mean, mode, median, percent difference and percent error for the collected data.
No restrictions on your remixing, redistributing, or making derivative works. Give credit to the author, as required.
Your remixing, redistributing, or making derivatives works comes with some restrictions, including how it is shared.
Your redistributing comes with some restrictions. Do not remix or make derivative works.
Most restrictive license type. Prohibits most uses, sharing, and any changes.
Copyrighted materials, available under Fair Use and the TEACH Act for US-based educators, or other custom arrangements. Go to the resource provider to see their individual restrictions.