This task examines, from a mathematical and statistical point of view, how …
This task examines, from a mathematical and statistical point of view, how scientists measure the age of organic materials by measuring the ratio of Carbon 14 to Carbon 12. The focus here is on the statistical nature of such dating. This task addresses a very important issue about precision in reporting and understanding statements in a realistic scientific context.
: Fundamental mathematics for adult learners. Book 5 includes a Table of …
: Fundamental mathematics for adult learners. Book 5 includes a Table of Contents, Glossary, Grades Records, Self Tests, Practice Tests and Unit Tests. Ancillary Resources include the Instructor's Manual. This is 1 of a series of 6 books in the ABE Math collection.
CK-12 Foundation's Basic Algebra FlexBook is an introduction to the algebraic topics …
CK-12 Foundation's Basic Algebra FlexBook is an introduction to the algebraic topics of functions, equations, and graphs for middle-school and high-school students.
This task was developed by high school and postsecondary mathematics and health …
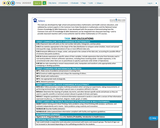
This task was developed by high school and postsecondary mathematics and health sciences educators, and validated by content experts in the Common Core State Standards in mathematics and the National Career Clusters Knowledge & Skills Statements. It was developed with the purpose of demonstrating how the Common Core and CTE Knowledge & Skills Statements can be integrated into classroom learning - and to provide classroom teachers with a truly authentic task for either mathematics or CTE courses.
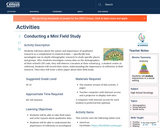
Students will learn about the nature and importance of qualitative research as …
Students will learn about the nature and importance of qualitative research as a complement to numerical data — specifically how sociologists use in-depth ethnographic research to study specific places and groups. After students investigate census data on the demographics of their school’s ZIP code, they will observe a location at their school (e.g., a student center or cafeteria). Students will record their notes, understanding the importance of reflexivity in field research. Then they will write a short paper about their field study.
The applet in this section allows for simple data analysis of univariate …
The applet in this section allows for simple data analysis of univariate data. Users can either generate normal or uniform data for k samples or copy and paste data from another source to a text box. A univariate analysis is performed for all k samples.
This task requires students to use the normal distribution as a model …
This task requires students to use the normal distribution as a model for a data distribution. Students must use given means and standard deviations to approximate population percentages. There are several ways (tables, graphing calculators, or statistical software) that students might calculate the required normal percentages. Depending on the method used, answers might vary somewhat from those shown in the solution.
1). Summarize and describe the distribution of a categorical variable in context. …
1). Summarize and describe the distribution of a categorical variable in context. 2). Generate and interpret several different graphical displays of the distribution of a quantitative variable (histogram, stemplot, boxplot). 3). Summarize and describe the distribution of a quantitative variable in context: a) describe the overall pattern, b) describe striking deviations from the pattern. 4). Relate measures of center and spread to the shape of the distribution, and choose the appropriate measures in different contexts. 5). Compare and contrast distributions (of quantitative data) from two or more groups, and produce a brief summary, interpreting your findings in context. 5). Apply the standard deviation rule to the special case of distributions having the "normal" shape.
This learning video presents an introduction to the Flaws of Averages using …
This learning video presents an introduction to the Flaws of Averages using three exciting examples: the ''crossing of the river'' example, the ''cookie'' example, and the ''dance class'' example. Averages are often worthwhile representations of a set of data by a single descriptive number. The objective of this module, however, is to simply point out a few pitfalls that could arise if one is not attentive to details when calculating and interpreting averages. The essential prerequisite knowledge for this video lesson is the ability to calculate an average from a set of numbers. During this video lesson, students will learn about three flaws of averages: (1) The average is not always a good description of the actual situation, (2) The function of the average is not always the same as the average of the function, and (3) The average depends on your perspective. To convey these concepts, the students are presented with the three real world examples mentioned above.
This problem could be used as an introductory lesson to introduce group …
This problem could be used as an introductory lesson to introduce group comparisons and to engage students in a question they may find amusing and interesting. More generally, the idea of the lesson could be used as a template for a project where students develop a questionnaire, sample students at their school and report on their findings.
This is course material published for a secondary Math 1 course. Authors of …
This is course material published for a secondary Math 1 course. Authors of this work are: Scott Hendrickson, Joleigh Honey, Barbara Kuehl, Travis Lemon, Janet Sutorius and updated from the original work in 2013 in partnership with the Utah State Office of Education.
The teacher will facilitate a class discussion for students to share their …
The teacher will facilitate a class discussion for students to share their opinions about young adulthood before they start the activity. After some teacher modeling, students will read, annotate, and answer questions about a technical document—including tables and graphs—to gather evidence to support conversations with their classmates about young adulthood. Then, students will write a paragraph about how their generation defines young adulthood.
This course is an introduction to data cleaning, analysis and visualization. We …
This course is an introduction to data cleaning, analysis and visualization. We will teach the basics of data analysis through concrete examples. You will learn how to take raw data, extract meaningful information, use statistical tools, and make visualizations. This was offered as a non-credit course during the Independent Activities Period (IAP), which is a special 4-week term at MIT that runs from the first week of January until the end of the month.
Elementary introduction with applications. Basic probability models. Combinatorics. Random variables. Discrete and …
Elementary introduction with applications. Basic probability models. Combinatorics. Random variables. Discrete and continuous probability distributions. Statistical estimation and testing. Confidence intervals. Introduction to linear regression.
" This course will provide a solid foundation in probability and statistics …
" This course will provide a solid foundation in probability and statistics for economists and other social scientists. We will emphasize topics needed for further study of econometrics and provide basic preparation for 14.32. Topics include elements of probability theory, sampling theory, statistical estimation, and hypothesis testing."
The book "Introductory Business Statistics" by Thomas K. Tiemann explores the basic …
The book "Introductory Business Statistics" by Thomas K. Tiemann explores the basic ideas behind statistics, such as populations, samples, the difference between data and information, and most importantly sampling distributions. The author covers topics including descriptive statistics and frequency distributions, normal and t-distributions, hypothesis testing, t-tests, f-tests, analysis of variance, non-parametric tests, and regression basics. Using real-world examples throughout the text, the author hopes to help students understand how statistics works, not just how to "get the right number."
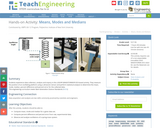
Students experience data collection, analysis and inquiry in this LEGO® MINDSTORMS® NXT …
Students experience data collection, analysis and inquiry in this LEGO® MINDSTORMS® NXT -based activity. They measure the position of an oscillating platform using a ultrasonic sensor and perform statistical analysis to determine the mean, mode, median, percent difference and percent error for the collected data.
CK-12 Foundation's Middle School Math Grade 6 Flexbook covers the fundamentals …
CK-12 Foundation's Middle School Math Grade 6 Flexbook covers the fundamentals of fractions, decimals, and geometry. Also explored are units of measurement, graphing concepts, and strategies for utilizing the book's content in practical situations.
This Flash based applet simulates data from a case study of treatments …
This Flash based applet simulates data from a case study of treatments for tumor growth in mice. This simulation allows the user to place mice into a control and treatment groups.
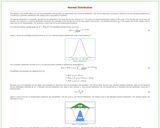
The applets in this section allow users to see how probabilities and …
The applets in this section allow users to see how probabilities and quantiles are determined from a Normal distribution. For calculating probabilities, set the mean, variance, and limits; for calculating quantiles, set the mean, variance, and probability.
No restrictions on your remixing, redistributing, or making derivative works. Give credit to the author, as required.
Your remixing, redistributing, or making derivatives works comes with some restrictions, including how it is shared.
Your redistributing comes with some restrictions. Do not remix or make derivative works.
Most restrictive license type. Prohibits most uses, sharing, and any changes.
Copyrighted materials, available under Fair Use and the TEACH Act for US-based educators, or other custom arrangements. Go to the resource provider to see their individual restrictions.