: Fundamental mathematics for adult learners. Book 5 includes a Table of …
: Fundamental mathematics for adult learners. Book 5 includes a Table of Contents, Glossary, Grades Records, Self Tests, Practice Tests and Unit Tests. Ancillary Resources include the Instructor's Manual. This is 1 of a series of 6 books in the ABE Math collection.
A statistics lesson on describing and making claims from data representations, specifically …
A statistics lesson on describing and making claims from data representations, specifically linearly increasing data. Applies ideas of rate-of-change to develop writing a linear equation to fit the data, using the equation to interpolate and extrapolate additional information, and integrating the mathematical interpretation appropriately into a social sciences argument.
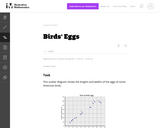
This task asks students to glean contextual information about bird eggs from …
This task asks students to glean contextual information about bird eggs from a collection of measurements of said eggs organized in a scatter plot. In particular, students are asked to identify a correlation and use it to make interpolative predictions, and reason about the properties of specific eggs via the graphical presentation of the data.
Students will learn about the nature and importance of qualitative research as …
Students will learn about the nature and importance of qualitative research as a complement to numerical data — specifically how sociologists use in-depth ethnographic research to study specific places and groups. After students investigate census data on the demographics of their school’s ZIP code, they will observe a location at their school (e.g., a student center or cafeteria). Students will record their notes, understanding the importance of reflexivity in field research. Then they will write a short paper about their field study.
Khan Academy tutorial video that uses Excel spreadsheet and actual income data …
Khan Academy tutorial video that uses Excel spreadsheet and actual income data to predict annual income and expresses why lines and models are useful and interesting.
This is course material published for a secondary Math 1 course. Authors of …
This is course material published for a secondary Math 1 course. Authors of this work are: Scott Hendrickson, Joleigh Honey, Barbara Kuehl, Travis Lemon, Janet Sutorius and updated from the original work in 2013 in partnership with the Utah State Office of Education.
This course is an introduction to data cleaning, analysis and visualization. We …
This course is an introduction to data cleaning, analysis and visualization. We will teach the basics of data analysis through concrete examples. You will learn how to take raw data, extract meaningful information, use statistical tools, and make visualizations. This was offered as a non-credit course during the Independent Activities Period (IAP), which is a special 4-week term at MIT that runs from the first week of January until the end of the month.
Elementary introduction with applications. Basic probability models. Combinatorics. Random variables. Discrete and …
Elementary introduction with applications. Basic probability models. Combinatorics. Random variables. Discrete and continuous probability distributions. Statistical estimation and testing. Confidence intervals. Introduction to linear regression.
This course is a self-contained introduction to statistics with economic applications. Elements …
This course is a self-contained introduction to statistics with economic applications. Elements of probability theory, sampling theory, statistical estimation, regression analysis, and hypothesis testing. It uses elementary econometrics and other applications of statistical tools to economic data. It also provides a solid foundation in probability and statistics for economists and other social scientists.
" This course will provide a solid foundation in probability and statistics …
" This course will provide a solid foundation in probability and statistics for economists and other social scientists. We will emphasize topics needed for further study of econometrics and provide basic preparation for 14.32. Topics include elements of probability theory, sampling theory, statistical estimation, and hypothesis testing."
The book "Introductory Business Statistics" by Thomas K. Tiemann explores the basic …
The book "Introductory Business Statistics" by Thomas K. Tiemann explores the basic ideas behind statistics, such as populations, samples, the difference between data and information, and most importantly sampling distributions. The author covers topics including descriptive statistics and frequency distributions, normal and t-distributions, hypothesis testing, t-tests, f-tests, analysis of variance, non-parametric tests, and regression basics. Using real-world examples throughout the text, the author hopes to help students understand how statistics works, not just how to "get the right number."
Students complete an exercise showing logarithmic relationships and examine how to find …
Students complete an exercise showing logarithmic relationships and examine how to find the linear regression of data that does not seem linear upon initial examination. They relate number of BMD scanners to time.
Students calculate the viscosity of various household fluids by measuring the amount …
Students calculate the viscosity of various household fluids by measuring the amount of time it takes marble or steel balls to fall given distances through the liquids. They experience what viscosity means, and also practice using algebra and unit conversions.
This Flash based applet simulates data from a case study of treatments …
This Flash based applet simulates data from a case study of treatments for tumor growth in mice. This simulation allows the user to place mice into a control and treatment groups.
CK-12 Advanced Probability and Statistics introduces students to basic topics in statistics …
CK-12 Advanced Probability and Statistics introduces students to basic topics in statistics and probability but finishes with the rigorous topics an advanced placement course requires. Includes visualizations of data, introduction to probability, discrete probability distribution, normal distribution, planning and conducting a study, sampling distributions, hypothesis testing, regression and correlation, Chi-Square, analysis of variance, and non-parametric statistics.
A work in progress, this FlexBook is an introduction to theoretical probability …
A work in progress, this FlexBook is an introduction to theoretical probability and data organization. Students learn about events, conditions, random variables, and graphs and tables that allow them to manage data.
This is a task from the Illustrative Mathematics website that is one …
This is a task from the Illustrative Mathematics website that is one part of a complete illustration of the standard to which it is aligned. Each task has at least one solution and some commentary that addresses important aspects of the task and its potential use.
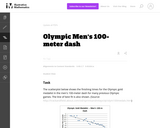
This is a task from the Illustrative Mathematics website that is one …
This is a task from the Illustrative Mathematics website that is one part of a complete illustration of the standard to which it is aligned. Each task has at least one solution and some commentary that addresses important asects of the task and its potential use. Here are the first few lines of the commentary for this task: The scatterplot below shows the finishing times for the Olympic gold medalist in the men's 100-meter dash for many previous Olympic games. The least sq...
Dawson (1995) presented a data set giving a population at risk and …
Dawson (1995) presented a data set giving a population at risk and fatalities for an “unusual episode” (the sinking of the ocean liner Titanic) and discussed the use of the data set in a first statistics course as an elementary exercise in statistical thinking, the goal being to deduce the origin of the data. Simonoff (1997) discussed the use of this data set in a second statistics course to illustrate logistic regression. Moore (2000) used an abbreviated form of the data set in a chapter exercise on the chi-square test. This article describes an activity that illustrates contingency table (two-way table) analysis. Students use contingency tables to analyze the “unusual episode” data (from Dawson 1995) and attempt to use their analysis to deduce the origin of the data. The activity is appropriate for use in an introductory college statistics course or in a high school AP statistics course.
As teachers of statistics, we know that residual plots and other diagnostics …
As teachers of statistics, we know that residual plots and other diagnostics are important to deciding whether or not linear regression is appropriate for a set of data. Despite talking with our students about this, many students might believe that if the correlation coefficient is strong enough, these diagnostic checks are not important. The data set included in this activity was created to lure students into a situation that looks on the surface to be appropriate for the use of linear regression but is instead based (loosely) on a quadratic function.
No restrictions on your remixing, redistributing, or making derivative works. Give credit to the author, as required.
Your remixing, redistributing, or making derivatives works comes with some restrictions, including how it is shared.
Your redistributing comes with some restrictions. Do not remix or make derivative works.
Most restrictive license type. Prohibits most uses, sharing, and any changes.
Copyrighted materials, available under Fair Use and the TEACH Act for US-based educators, or other custom arrangements. Go to the resource provider to see their individual restrictions.