The goal of this task is to get students to focus on …
The goal of this task is to get students to focus on the shape of the graph of the equation y=ex and how this changes depending on the sign of the exponent and on whether the exponential is in the numerator or denominator. It is also intended to develop familiarity, in the case of f and k, with the functions which are used in logistic growth models, further examined in ``Logistic Growth Model, Explicit Case'' and ``Logistic Growth Model, Abstract Verson.''
Students will examine data on the number of immigrants in the United …
Students will examine data on the number of immigrants in the United States, to create bar graphs and line graphs with appropriate scales. Students will then compare and analyze their graphs to draw conclusions about the data.
This lesson unit is intended to help teachers assess how well students …
This lesson unit is intended to help teachers assess how well students are able to interpret distanceĐtime graphs and, in particular, to help you identify students who: interpret distanceĐtime graphs as if they are pictures of situations rather than abstract representations of them; and have difficulty relating speeds to slopes of these graphs.
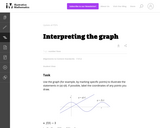
The purpose of this task is to help students learn to read …
The purpose of this task is to help students learn to read information about a function from its graph, by asking them to show the part of the graph that exhibits a certain property of the function. The task could be used to further instruction on understanding functions, or as an assessment tool with the caveat that it requires some amount of creativity to decide how to best illustrate some of the statements.
This course provides an introduction to mathematical modeling of computational problems. It …
This course provides an introduction to mathematical modeling of computational problems. It covers the common algorithms, algorithmic paradigms, and data structures used to solve these problems. The course emphasizes the relationship between algorithms and programming, and introduces basic performance measures and analysis techniques for these problems.
This lesson unit is intended to help teahcers assess how well students …
This lesson unit is intended to help teahcers assess how well students are able to interpret speed as the slope of a linear graph and translate between the equation of a line and its graphical representation.
In this group task students collect data and analyze from the class …
In this group task students collect data and analyze from the class to answer the question "is there an association between whether a student plays a sport and whether he or she plays a musical instrument? "
(Nota: Esta es una traducción de un recurso educativo abierto creado por …
(Nota: Esta es una traducción de un recurso educativo abierto creado por el Departamento de Educación del Estado de Nueva York (NYSED) como parte del proyecto "EngageNY" en 2013. Aunque el recurso real fue traducido por personas, la siguiente descripción se tradujo del inglés original usando Google Translate para ayudar a los usuarios potenciales a decidir si se adapta a sus necesidades y puede contener errores gramaticales o lingüísticos. La descripción original en inglés también se proporciona a continuación.)
Este módulo de 10 días se basa en conceptos de grado 2 sobre datos, gráficos y parcelas de línea. Los dos temas en este módulo se centran en generar y analizar datos categóricos y de medición. Al final del módulo, los estudiantes están trabajando con una mezcla de gráficos de imágenes escalados, gráficos de barras y gráficos de línea para resolver problemas utilizando datos categóricos y de medición.
Encuentre el resto de los recursos matemáticos de Engageny en https://archive.org/details/engageny-mathematics.
English Description: This 10-day module builds on Grade 2 concepts about data, graphing, and line plots. The two topics in this module focus on generating and analyzing categorical and measurement data. By the end of the module, students are working with a mixture of scaled picture graphs, bar graphs, and line plots to problem solve using both categorical and measurement data.
Find the rest of the EngageNY Mathematics resources at https://archive.org/details/engageny-mathematics.
(Nota: Esta es una traducción de un recurso educativo abierto creado por …
(Nota: Esta es una traducción de un recurso educativo abierto creado por el Departamento de Educación del Estado de Nueva York (NYSED) como parte del proyecto "EngageNY" en 2013. Aunque el recurso real fue traducido por personas, la siguiente descripción se tradujo del inglés original usando Google Translate para ayudar a los usuarios potenciales a decidir si se adapta a sus necesidades y puede contener errores gramaticales o lingüísticos. La descripción original en inglés también se proporciona a continuación.)
En el módulo 4, los estudiantes extienden lo que ya saben sobre las tarifas unitarias y las relaciones proporcionales con ecuaciones lineales y sus gráficos. Los estudiantes entienden las conexiones entre relaciones proporcionales, líneas y ecuaciones lineales en este módulo. Los estudiantes aprenden a aplicar las habilidades que adquirieron en los grados 6 y 7, con respecto a la notación simbólica y las propiedades de la igualdad para transcribir y resolver ecuaciones en una variable y luego en dos variables.
Encuentre el resto de los recursos matemáticos de Engageny en https://archive.org/details/engageny-mathematics.
English Description: In Module 4, students extend what they already know about unit rates and proportional relationships to linear equations and their graphs. Students understand the connections between proportional relationships, lines, and linear equations in this module. Students learn to apply the skills they acquired in Grades 6 and 7, with respect to symbolic notation and properties of equality to transcribe and solve equations in one variable and then in two variables.
Find the rest of the EngageNY Mathematics resources at https://archive.org/details/engageny-mathematics.
In this lesson, through various examples and activities, exponential growth and polynomial …
In this lesson, through various examples and activities, exponential growth and polynomial growth are compared to develop an insight about how quickly the number can grow or decay in exponentials. A basic knowledge of scientific notation, plotting graphs and finding intersection of two functions is assumed.
A work in progress, this FlexBook is an introduction to theoretical probability …
A work in progress, this FlexBook is an introduction to theoretical probability and data organization. Students learn about events, conditions, random variables, and graphs and tables that allow them to manage data.
Building on their understanding of graphs, students are introduced to random processes …
Building on their understanding of graphs, students are introduced to random processes on networks. They walk through an illustrative example to see how a random process can be used to represent the spread of an infectious disease, such as the flu, on a social network of students. This demonstrates how scientists and engineers use mathematics to model and simulate random processes on complex networks. Topics covered include random processes and modeling disease spread, specifically the SIR (susceptible, infectious, resistant) model.
This lesson aims to help students with quadratic functions y = ax2 …
This lesson aims to help students with quadratic functions y = ax2 + bx + c. This is the next step after linear functions bx + c. The lesson begins with three quadratics and their graphs (three parabolas): y = x2 - 2x + (0 or 1 or 2). The prerequisite or co-requisite is some working experience with algebra, like factoring x2 -2x into x(x-2). The objective is to connect four things: the formula for y, the graph of y (a parabola), the roots of y and the minimum or maximum of y. The particular example y = x2 – 2x could be repeated by the teacher, for emphasis. The lesson will take more than one class period (and this is deserved!). The breaks allow time to consider parabolas starting with -x2 and opening downward. A physical path would be one (dangerous?) activity.
The typical system of equations or inequalities problem gives the system and …
The typical system of equations or inequalities problem gives the system and asks for the graph of the solution. This task turns the problem around. It gives a solution set and asks for the system that corresponds to it. The purpose of this task is to give students a chance to go beyond the typical problem and make the connections between points in the coordinate plane and solutions to inequalities and equations. Students have to focus on what the graph is showing.
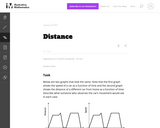
In this task students interpret two graphs that look the same but …
In this task students interpret two graphs that look the same but show very different quantities. The first graph gives information about how fast a car is moving while the second graph gives information about the position of the car. This problem works well to generate a class or small group discussion. Students learn that graphs tell stories and have to be interpreted by carefully thinking about the quantities shown.
No restrictions on your remixing, redistributing, or making derivative works. Give credit to the author, as required.
Your remixing, redistributing, or making derivatives works comes with some restrictions, including how it is shared.
Your redistributing comes with some restrictions. Do not remix or make derivative works.
Most restrictive license type. Prohibits most uses, sharing, and any changes.
Copyrighted materials, available under Fair Use and the TEACH Act for US-based educators, or other custom arrangements. Go to the resource provider to see their individual restrictions.