Students will examine and interpret a population chart published in 1898 — …
Students will examine and interpret a population chart published in 1898 — depicting changes in the makeup of the United States across time in three categories, “foreign stock,” “native stock,” and “colored” — as well as an 1893 political cartoon about immigration. Students will also explain the causes and effects of population change in the late 19th century.
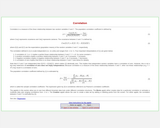
This task addresses many standards regarding the description and analysis of bivariate …
This task addresses many standards regarding the description and analysis of bivariate quantitative data, including regression and correlation. Students should recognize that the pattern shown is one of a strong, positive, linear association, and thus a correlation coefficient value near +1 is plausible. Students should also be able to interpret the slope of the least-squares line as an estimated increase in y per unit change in x (and thus for a 3 unit increase in x, students should expect an estimated increase in y that equals 3 times the model's slope value).
: Fundamental mathematics for adult learners. Book 5 includes a Table of …
: Fundamental mathematics for adult learners. Book 5 includes a Table of Contents, Glossary, Grades Records, Self Tests, Practice Tests and Unit Tests. Ancillary Resources include the Instructor's Manual. This is 1 of a series of 6 books in the ABE Math collection.
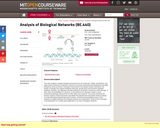
This class analyzes complex biological processes from the molecular, cellular, extracellular, and …
This class analyzes complex biological processes from the molecular, cellular, extracellular, and organ levels of hierarchy. Emphasis is placed on the basic biochemical and biophysical principles that govern these processes. Examples of processes to be studied include chemotaxis, the fixation of nitrogen into organic biological molecules, growth factor and hormone mediated signaling cascades, and signaling cascades leading to cell death in response to DNA damage. In each case, the availability of a resource, or the presence of a stimulus, results in some biochemical pathways being turned on while others are turned off. The course examines the dynamic aspects of these processes and details how biochemical mechanistic themes impinge on molecular/cellular/tissue/organ-level functions. Chemical and quantitative views of the interplay of multiple pathways as biological networks are emphasized. Student work will culminate in the preparation of a unique grant application in an area of biological networks.
Students will explore maps containing census data from 1950 through 2000. They …
Students will explore maps containing census data from 1950 through 2000. They will analyze how education levels and median household incomes have changed over time and determine how the two might be correlated. Students will also come up with ideas for policies that could help address issues related to income and education.
Students will examine a table of 1850 Census data on employment to …
Students will examine a table of 1850 Census data on employment to understand the professions of free men across the United States at the time, calculating the percentages working in different industries. Students will also compare and contrast economies in the North and South during the Antebellum Period.
Students will use state and regional unemployment data for various education levels …
Students will use state and regional unemployment data for various education levels to create scatter plots and calculate correlation coefficients. Students will then compare scatter plots with different strengths of linear relationships and will determine the impact of any influential points on the correlation coefficient.
The applets in this section allow you to see how different bivariate …
The applets in this section allow you to see how different bivariate data look under different correlation structures. The Movie applet either creates data for a particular correlation or animates a multitude data sets ranging correlations from -1 to 1.
Students will develop, justify, and evaluate conjectures about the relationship between two …
Students will develop, justify, and evaluate conjectures about the relationship between two quantitative variables over time in the United States: the median age (in years) when women first marry and the percentage of women aged 25–34 with a bachelor’s degree or higher. Students will write a regression equation for the data, interpret in context the linear model’s slope and y-intercept, and find the correlation coefficient (r), assessing the strength of the linear relationship and whether a significant relationship exists between the variables. Students will then summarize their conclusions and consider whether correlation implies causation.
This is a simple task addressing the distinction between correlation and causation. …
This is a simple task addressing the distinction between correlation and causation. Students are given information indicating a correlation between two variables, and are asked to reason out whether or not a causation can be inferred. The task would be well-suited either as an introduction to this distinction, or as an assessment item.
This is course material published for a secondary Math 1 course. Authors of …
This is course material published for a secondary Math 1 course. Authors of this work are: Scott Hendrickson, Joleigh Honey, Barbara Kuehl, Travis Lemon, Janet Sutorius and updated from the original work in 2013 in partnership with the Utah State Office of Education.
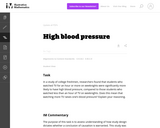
The purpose of this task is to assess understanding of how study …
The purpose of this task is to assess understanding of how study design dictates whether a conclusion of causation is warranted. This study was observational and not an experiment, which means that it is not possible to reach a cause-and-effect conclusion.
This course is an introduction to data cleaning, analysis and visualization. We …
This course is an introduction to data cleaning, analysis and visualization. We will teach the basics of data analysis through concrete examples. You will learn how to take raw data, extract meaningful information, use statistical tools, and make visualizations. This was offered as a non-credit course during the Independent Activities Period (IAP), which is a special 4-week term at MIT that runs from the first week of January until the end of the month.
Elementary introduction with applications. Basic probability models. Combinatorics. Random variables. Discrete and …
Elementary introduction with applications. Basic probability models. Combinatorics. Random variables. Discrete and continuous probability distributions. Statistical estimation and testing. Confidence intervals. Introduction to linear regression.
" This course will provide a solid foundation in probability and statistics …
" This course will provide a solid foundation in probability and statistics for economists and other social scientists. We will emphasize topics needed for further study of econometrics and provide basic preparation for 14.32. Topics include elements of probability theory, sampling theory, statistical estimation, and hypothesis testing."
The book "Introductory Business Statistics" by Thomas K. Tiemann explores the basic …
The book "Introductory Business Statistics" by Thomas K. Tiemann explores the basic ideas behind statistics, such as populations, samples, the difference between data and information, and most importantly sampling distributions. The author covers topics including descriptive statistics and frequency distributions, normal and t-distributions, hypothesis testing, t-tests, f-tests, analysis of variance, non-parametric tests, and regression basics. Using real-world examples throughout the text, the author hopes to help students understand how statistics works, not just how to "get the right number."
Meg set out to climb up and investigate the rain forest tree …
Meg set out to climb up and investigate the rain forest tree canopies — and to be the first scientist to do so. But she encountered challenge after challenge. Male teachers would not let her into their classrooms, the high canopy was difficult to get to, and worst of all, people were logging and clearing the forests. Meg never gave up or gave in. She studied, invented, and persevered, not only creating a future for herself as a scientist, but making sure that the rainforests had a future as well. The resource includes a lesson plan/book card, a design challenge, and copy of a design thinking journal that provide guidance on using the book to inspire students' curiosity for design thinking. Maker Challenge: Your community has many different areas to explore - it might be a park, a grocery store, a forest, or an alley. For some people, it might be difficult to explore these areas because they may have differing abilities. Select one area in your community, and come up with a plan to build a way for it to be more accessible to everyone.
A document is included in the resources folder that lists the complete standards-alignment for this book activity.
This Flash based applet simulates data from a case study of treatments …
This Flash based applet simulates data from a case study of treatments for tumor growth in mice. This simulation allows the user to place mice into a control and treatment groups.
This course is an introduction to statistical data analysis. Topics are chosen …
This course is an introduction to statistical data analysis. Topics are chosen from applied probability, sampling, estimation, hypothesis testing, linear regression, analysis of variance, categorical data analysis, and nonparametric statistics.
This course is a broad treatment of statistics, concentrating on specific statistical …
This course is a broad treatment of statistics, concentrating on specific statistical techniques used in science and industry. Topics include: hypothesis testing and estimation, confidence intervals, chi-square tests, nonparametric statistics, analysis of variance, regression, correlation, decision theory, and Bayesian statistics.
No restrictions on your remixing, redistributing, or making derivative works. Give credit to the author, as required.
Your remixing, redistributing, or making derivatives works comes with some restrictions, including how it is shared.
Your redistributing comes with some restrictions. Do not remix or make derivative works.
Most restrictive license type. Prohibits most uses, sharing, and any changes.
Copyrighted materials, available under Fair Use and the TEACH Act for US-based educators, or other custom arrangements. Go to the resource provider to see their individual restrictions.